A GIS-based method for identifying gaps in building footprint coverage
Identifying gaps in large-scale building footprint layers is challenging… can the Open Building Population Layer help?
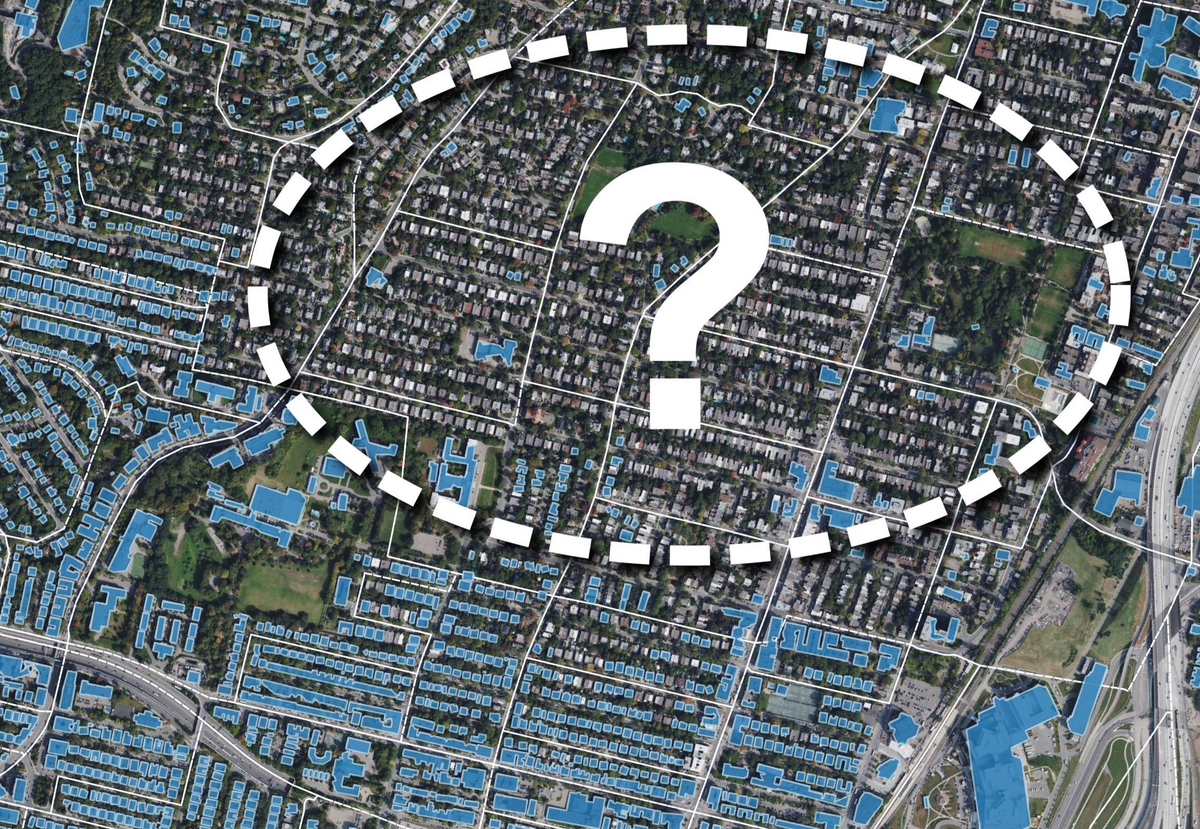 Building footprints missing on satellite imagery (Microsoft Bing)
This analysis is based on the deprecated version of the open building population layer. The new documentation based on 2021 census data is available at Open Building Population Layer (Canada) - 2021 and includes updated validation results for building gaps.
The Open Building Population Layer (Canada) is a personal project by Maxim Fortin. It is not an official Government of Canada data source for building footprints or population distribution. No warranty is given as to the accuracy or completeness of the information provided.
Table of Contents
1. Why was this method developed?
As I was working on the new release of the Open Building Population Layer, I realized that I needed to find ways to evaluate and control the quality of the datasets. The process used to estimate building population is simple and straight-forward, the results seem acceptable in spot-checks although I was able to find occasional gaps in the data. How to do quality control on tens of millions of building points?
This article has the following two objectives:
- Explain the method used to identify gaps in large-scale building footprint layers
- Present analysis results and potential areas of concern in the Open Building Population Layer (Canada)
2. How does this method work?
The method developed is a “back-check” on the building population data, by calculating the population sum from the Open Building Population Layer for each census sub-division (CSD) and then comparing with the official census sub-division population (2016 census). The assumption being that if these values match up, the open building population layer provides a reasonable overview of the population distribution in a given area. If there are large differences, then there is a problem.
The comparison process was implemented in Python using the Geopandas library:
- Assign population to existing building points using census data at dissemination area level (already completed with Open Building Population Layer)
- Sum calculated building population and aggregate at census sub-division level
- Compare population aggregated from buildings at the census sub-division level with official census data for census sub-divisions
- Identify census sub-divisions with differences in population
The Open Building Population Layer was calculated using census dissemination areas. The comparison process works on the premise that if no building point was located within a dissemination area, then the population from that dissemination area would not be accounted for in the Open Building Population Layer.
The figure below provides a visual example.
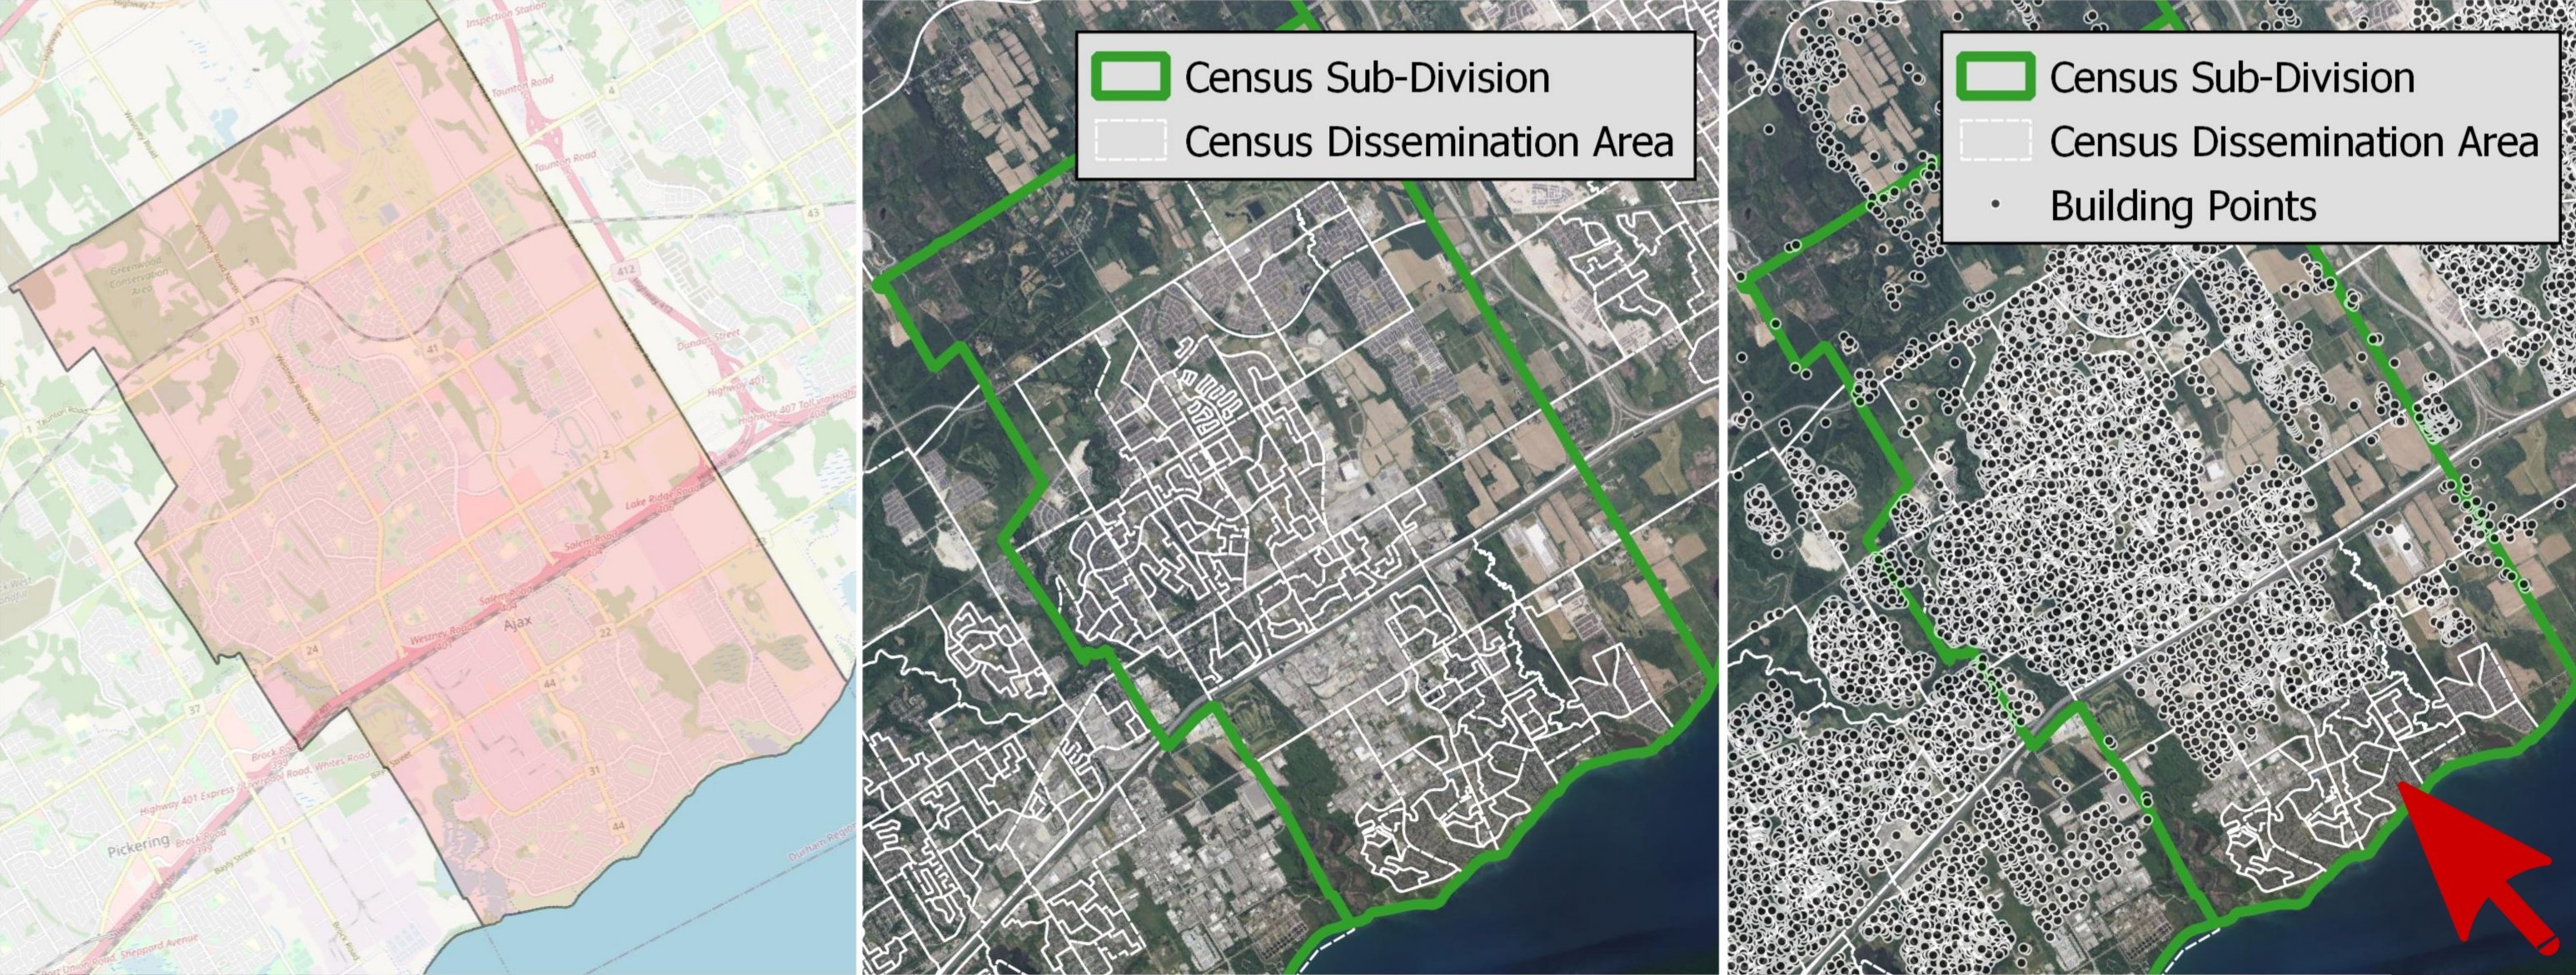
- Left: The census sub-division for Ajax (Ontario) is highlighted in red, with OSM basemap. Comparison results indicate that this census sub-division is missing 18,288 out of 119,677 people (-15.28%).
- Center: The census sub-division and dissemination area boundaries are presented with a Bing satellite imagery basemap. In total, 179 census dissemination areas are located within the Ajax census sub-division.
- Right: The census layers as well as the available building points are presented with a Bing satellite imagery basemap. The red arrow on the bottom right indicates a small zone where building points are missing (along the Lake Ontario coastline). The approximately 30 dissemination areas located in that zone are the ones for which population are not accounted for in the overall Open Building Population Layer.
3. What are the general results?
The table below presents the comparison results for each province and territory.
| Province & territory | Sum from census data 2016 | Sum from Open Building Population Layer 2016 | Difference | Difference (%) |
|---|---|---|---|---|
| AB | 4,067,175 | 4,066,342 | -833 | -0.02 |
| BC | 4,648,055 | 4,638,113 | -9,942 | -0.21 |
| MB | 1,278,365 | 1,274,420 | -3,945 | -0.31 |
| NB | 747,101 | 746,602 | -499 | -0.07 |
| NL | 519,716 | 511,372 | -8,344 | -1.61 |
| NS | 923,598 | 922,513 | -1,085 | -0.12 |
| NU | 35,944 | 15,008 | -20,936 | -58.25 |
| NWT | 41,786 | 40,078 | -1,708 | -4.09 |
| ON | 13,448,494 | 13,259,208 | -189,286 | -1.41 |
| PEI | 142,907 | 142,866 | -41 | -0.03 |
| QC | 8,164,361 | 8,110,945 | -53,416 | -0.65 |
| SK | 1,098,352 | 1,097,910 | -442 | -0.04 |
| YK | 35,874 | 33,424 | -2,450 | -6.83 |
| Total | 35,115,854 | 34,825,377 | -290,477 | -0.83 |
There is a trend across all provinces and territories to have a re-calculated population lower than the official census population, which means that some population is not accounted for in the building population layer.
The jurisdictions with the largest differences are Nunavut (-58.3%), Yukon (-6.8%) and Northwest Territories (-4.1%), all located north of the 60th parallel. Specifically, this indicates that the open building population layer should not be used for analysis in Nunavut. The applicability of the layer in Yukon and Northwest Territories would also depend on the type of analysis conducted and level of detail required. Missing footprints in the original building data affected the quality of the Open Building Population Layer.
Differences for provinces located south of the 60th parallel range from 0 to -1.4%, indicating that the building population layer captures a majority of the population in those regions. However, localized issues are present in each province and should be carefully reviewed before Open Building Population Layer data is used. Some of these issues are discussed in the following section.
4. Where are the gaps in the Open Building Population Layer (Canada)?
The back-calculation doesn’t only provide a general overview per province or territory. It can also be useful to identify specific areas of concern within a large-scale or global building layer: census sub-divisions that indicate large gaps in building points.
The figures below provide an example. The area of interest is located approximately 70 km north-west of Montreal, QC. The census sub-division layer indicates the population difference (%) resulting from the back-calculation.
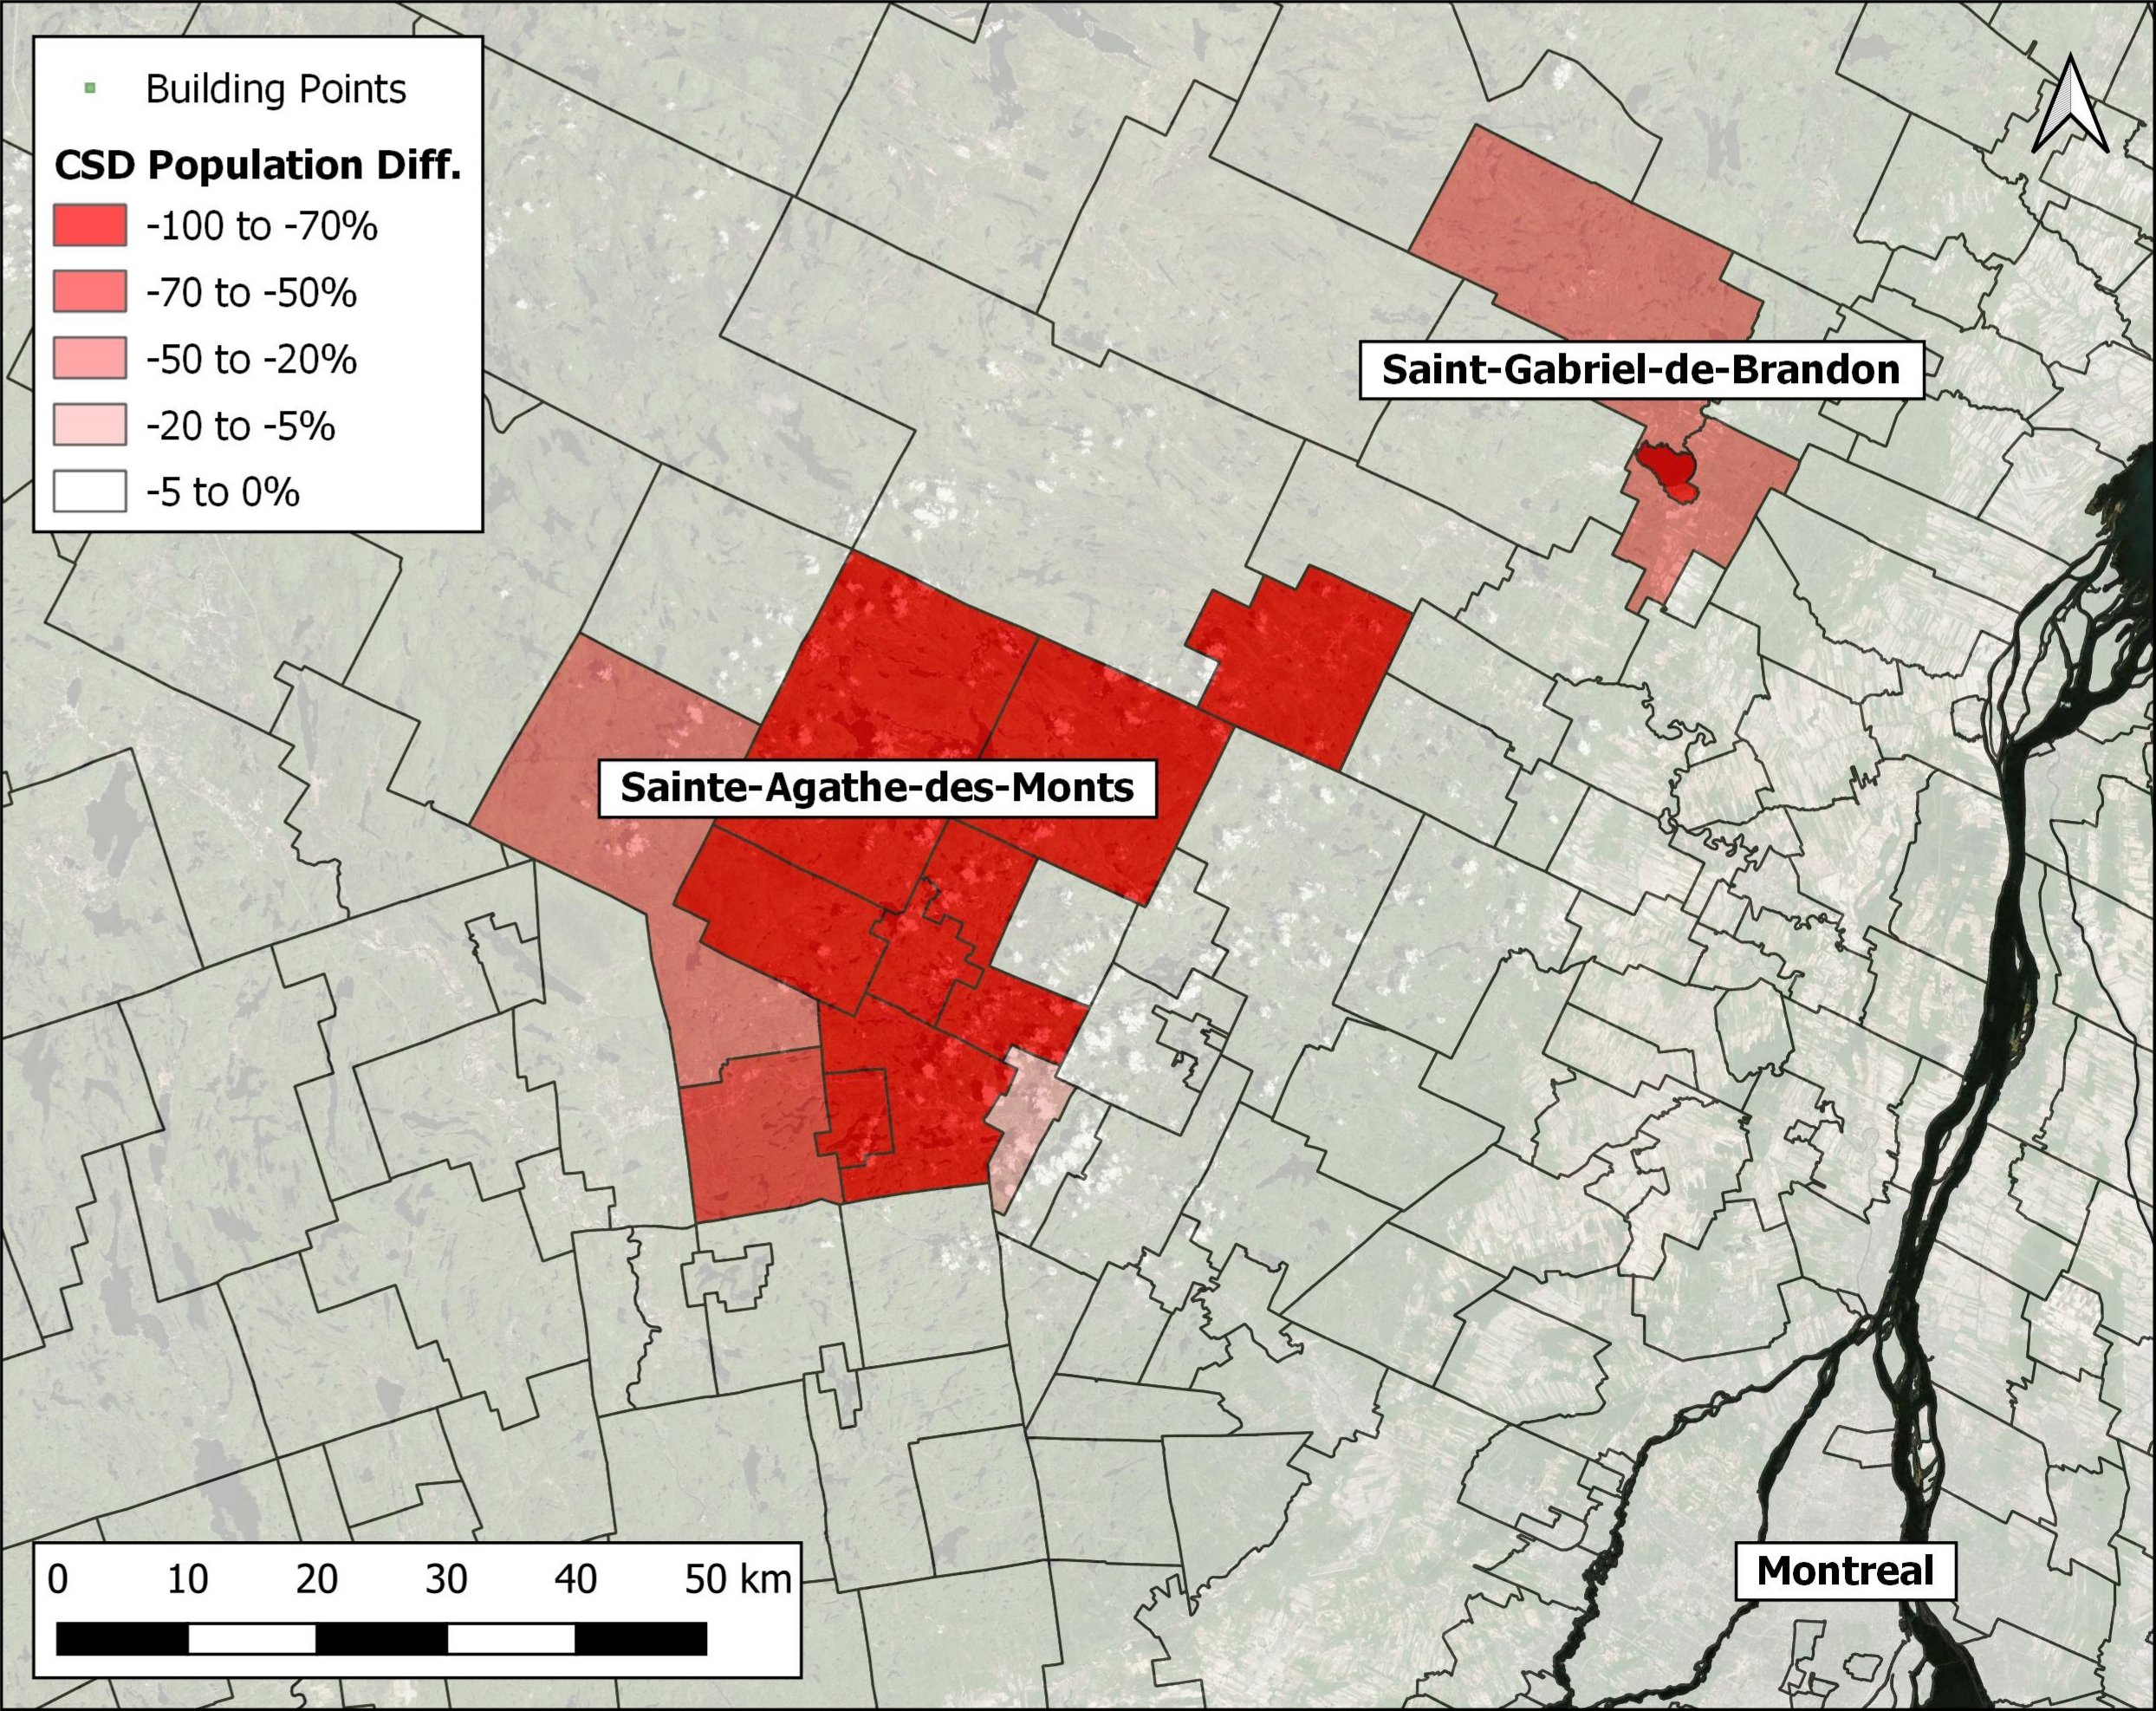
Census sub-divisions with a large population difference are identified with the white-to-red gradient. Two examples with visible gaps are shown in the figures below for “Sainte-Agathe-des-Monts” and “Saint-Gabriel-de-Brandon”.
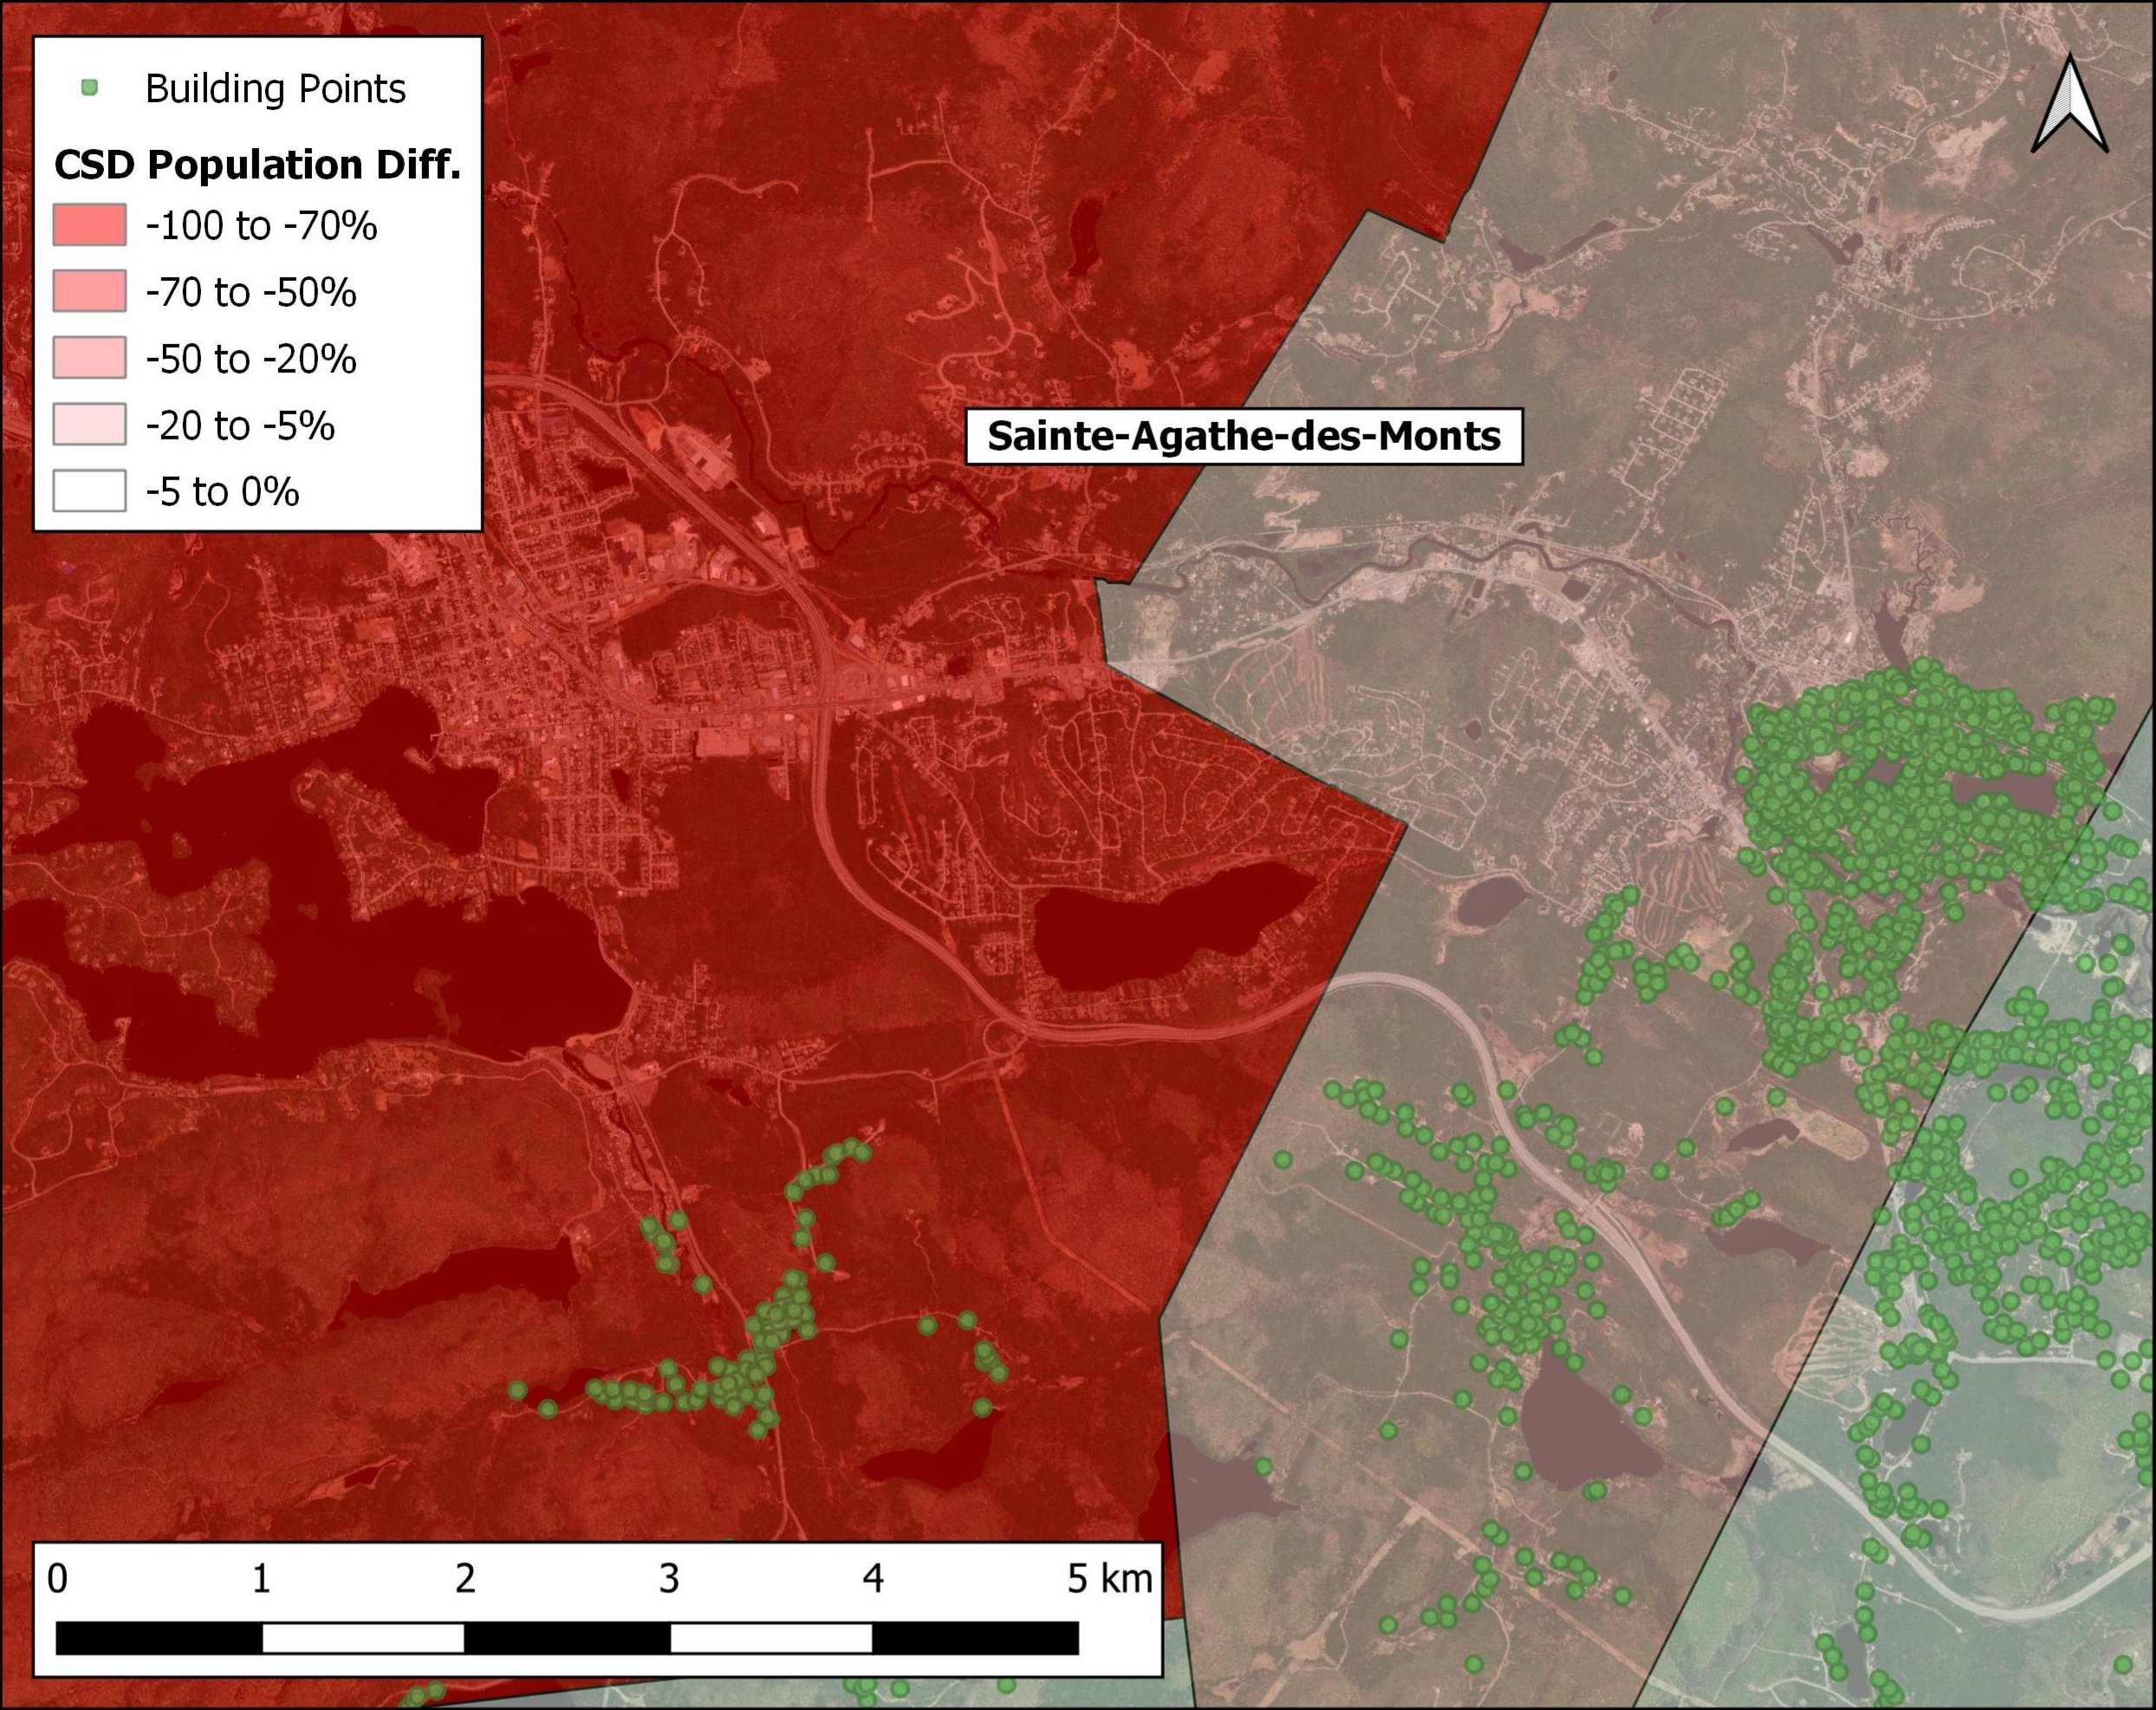
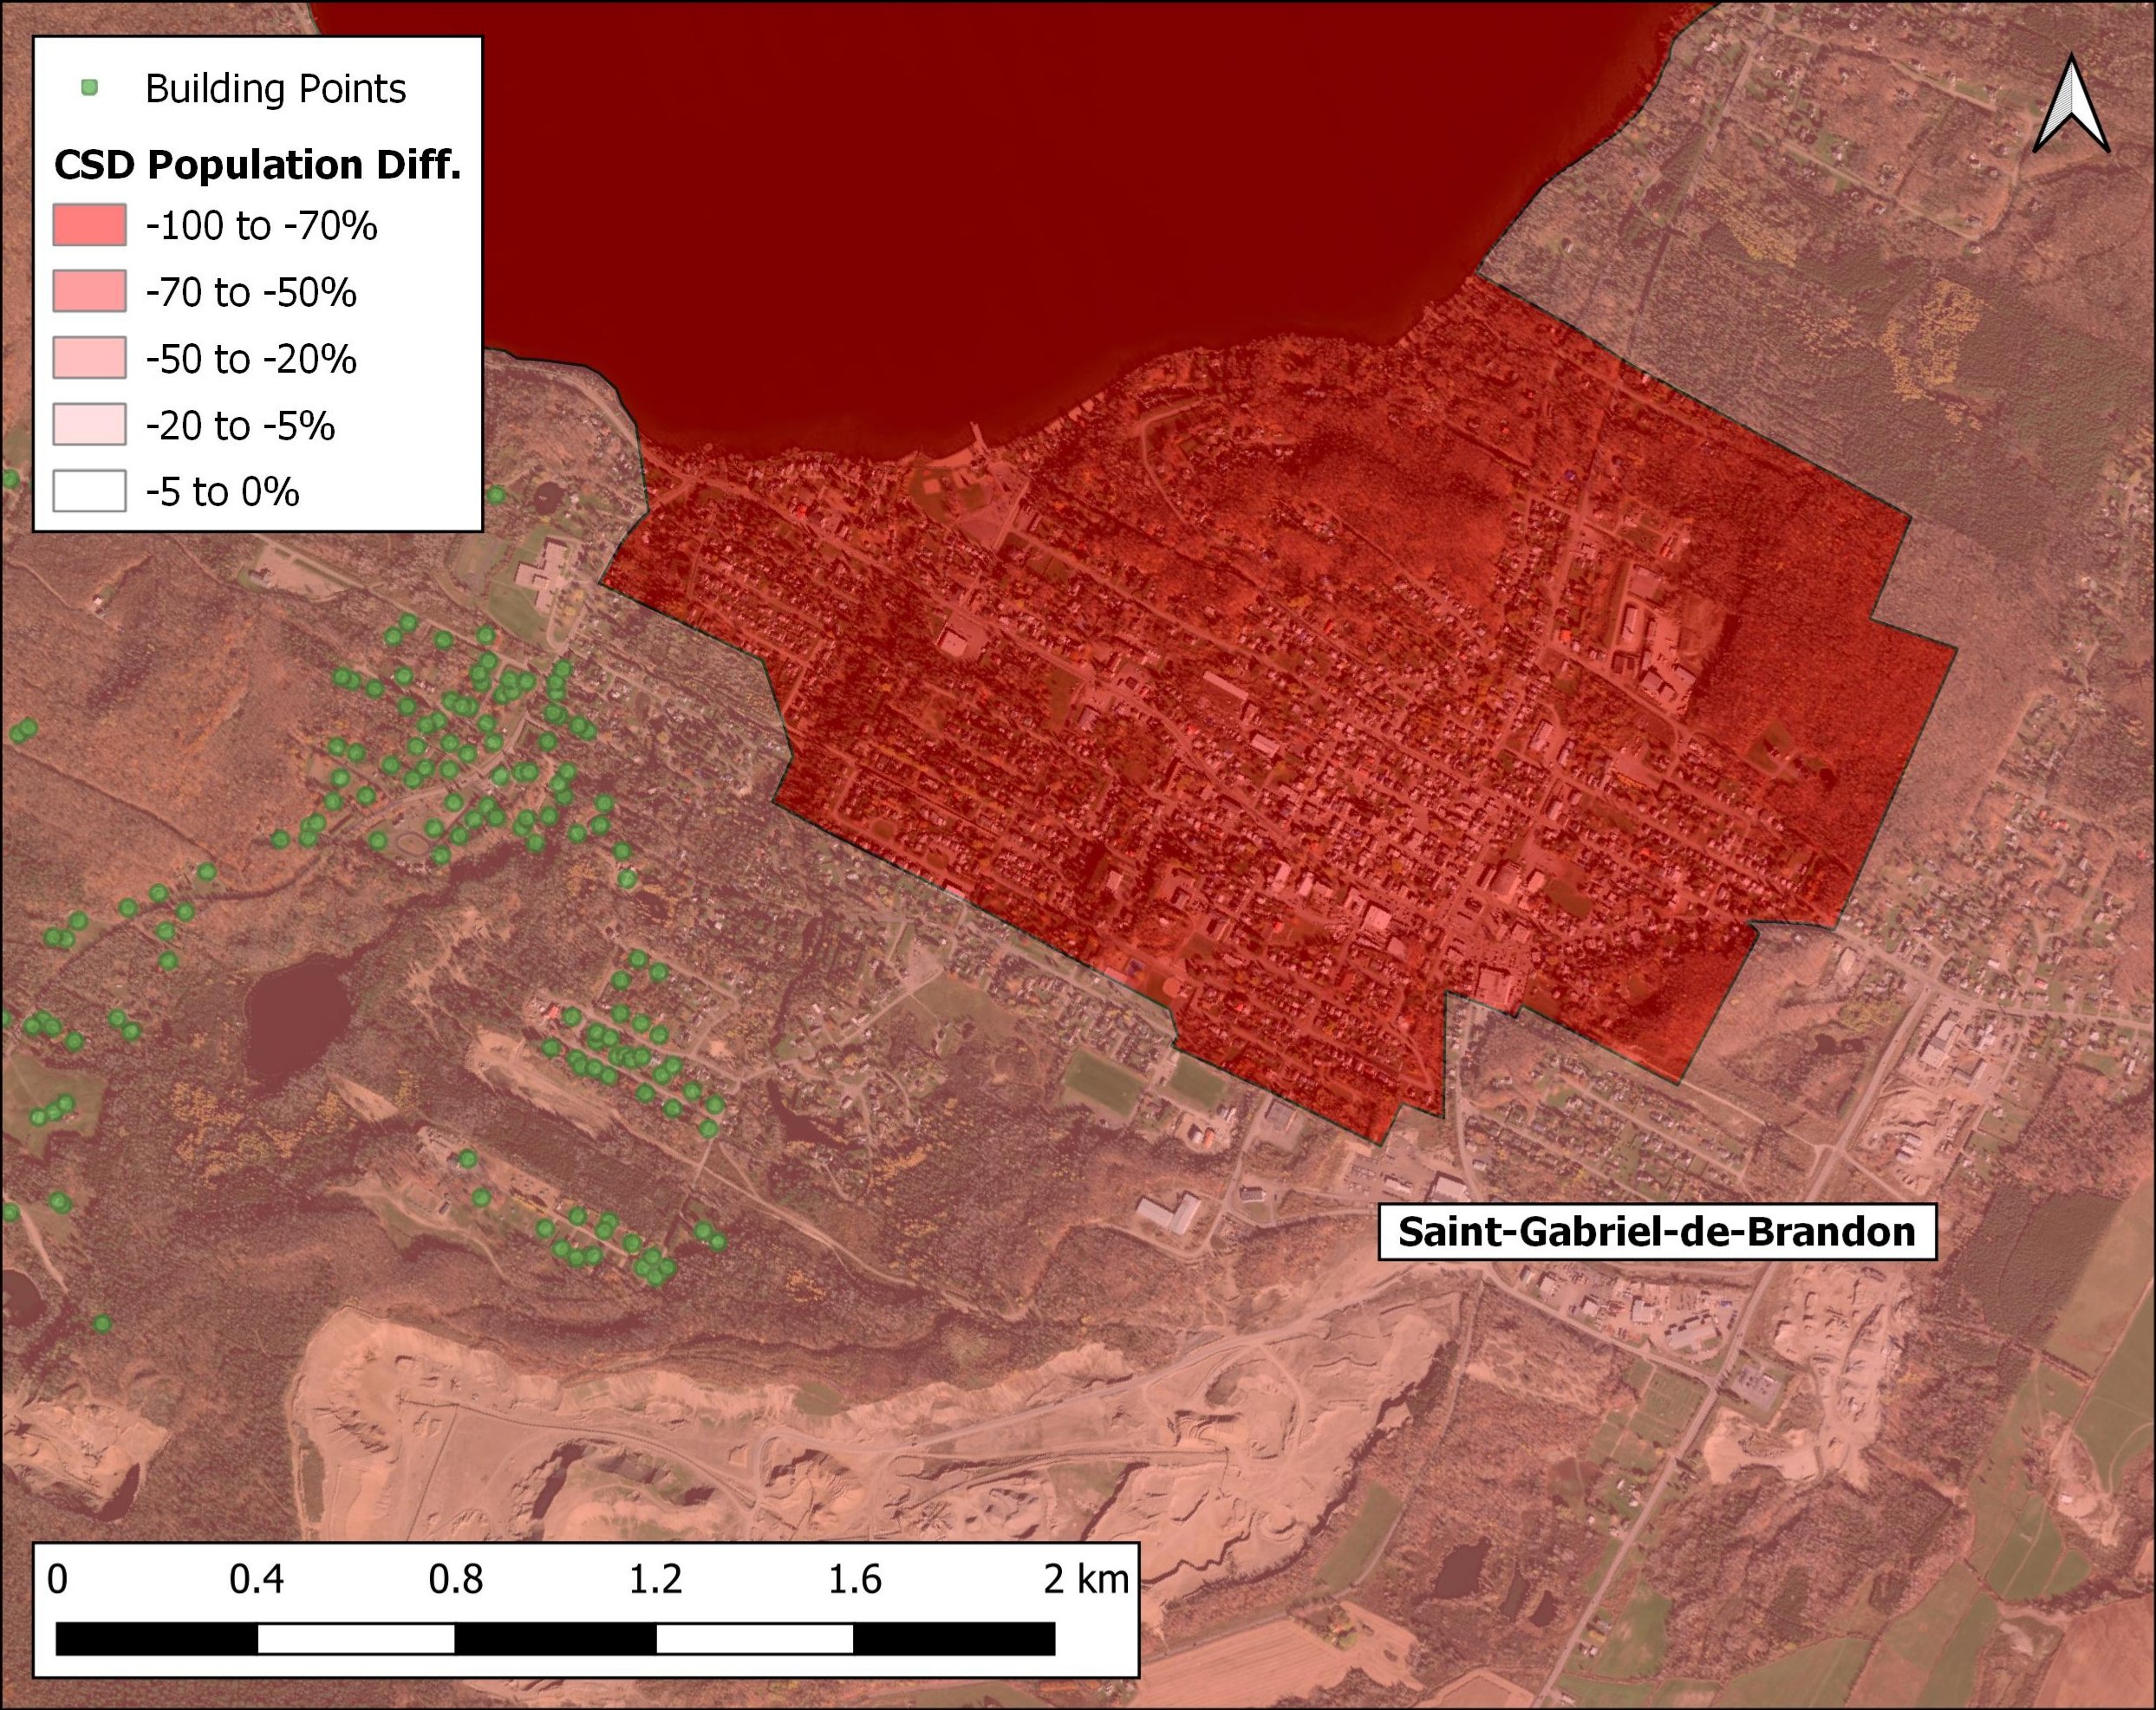
As you zoom into these areas, it becomes noticeable that there are urban areas visible on the Bing satellite imagery that do not have building points identified. Such gaps can be difficult to detect at a large scale, but the back-calculation results indicate that they are not uncommon. In total, 222 out of the total 5,162 census sub-divisions considered in the analysis show a population difference of 5% or more.
The figure below presents a regional overview for the southern parts of Quebec and Ontario.
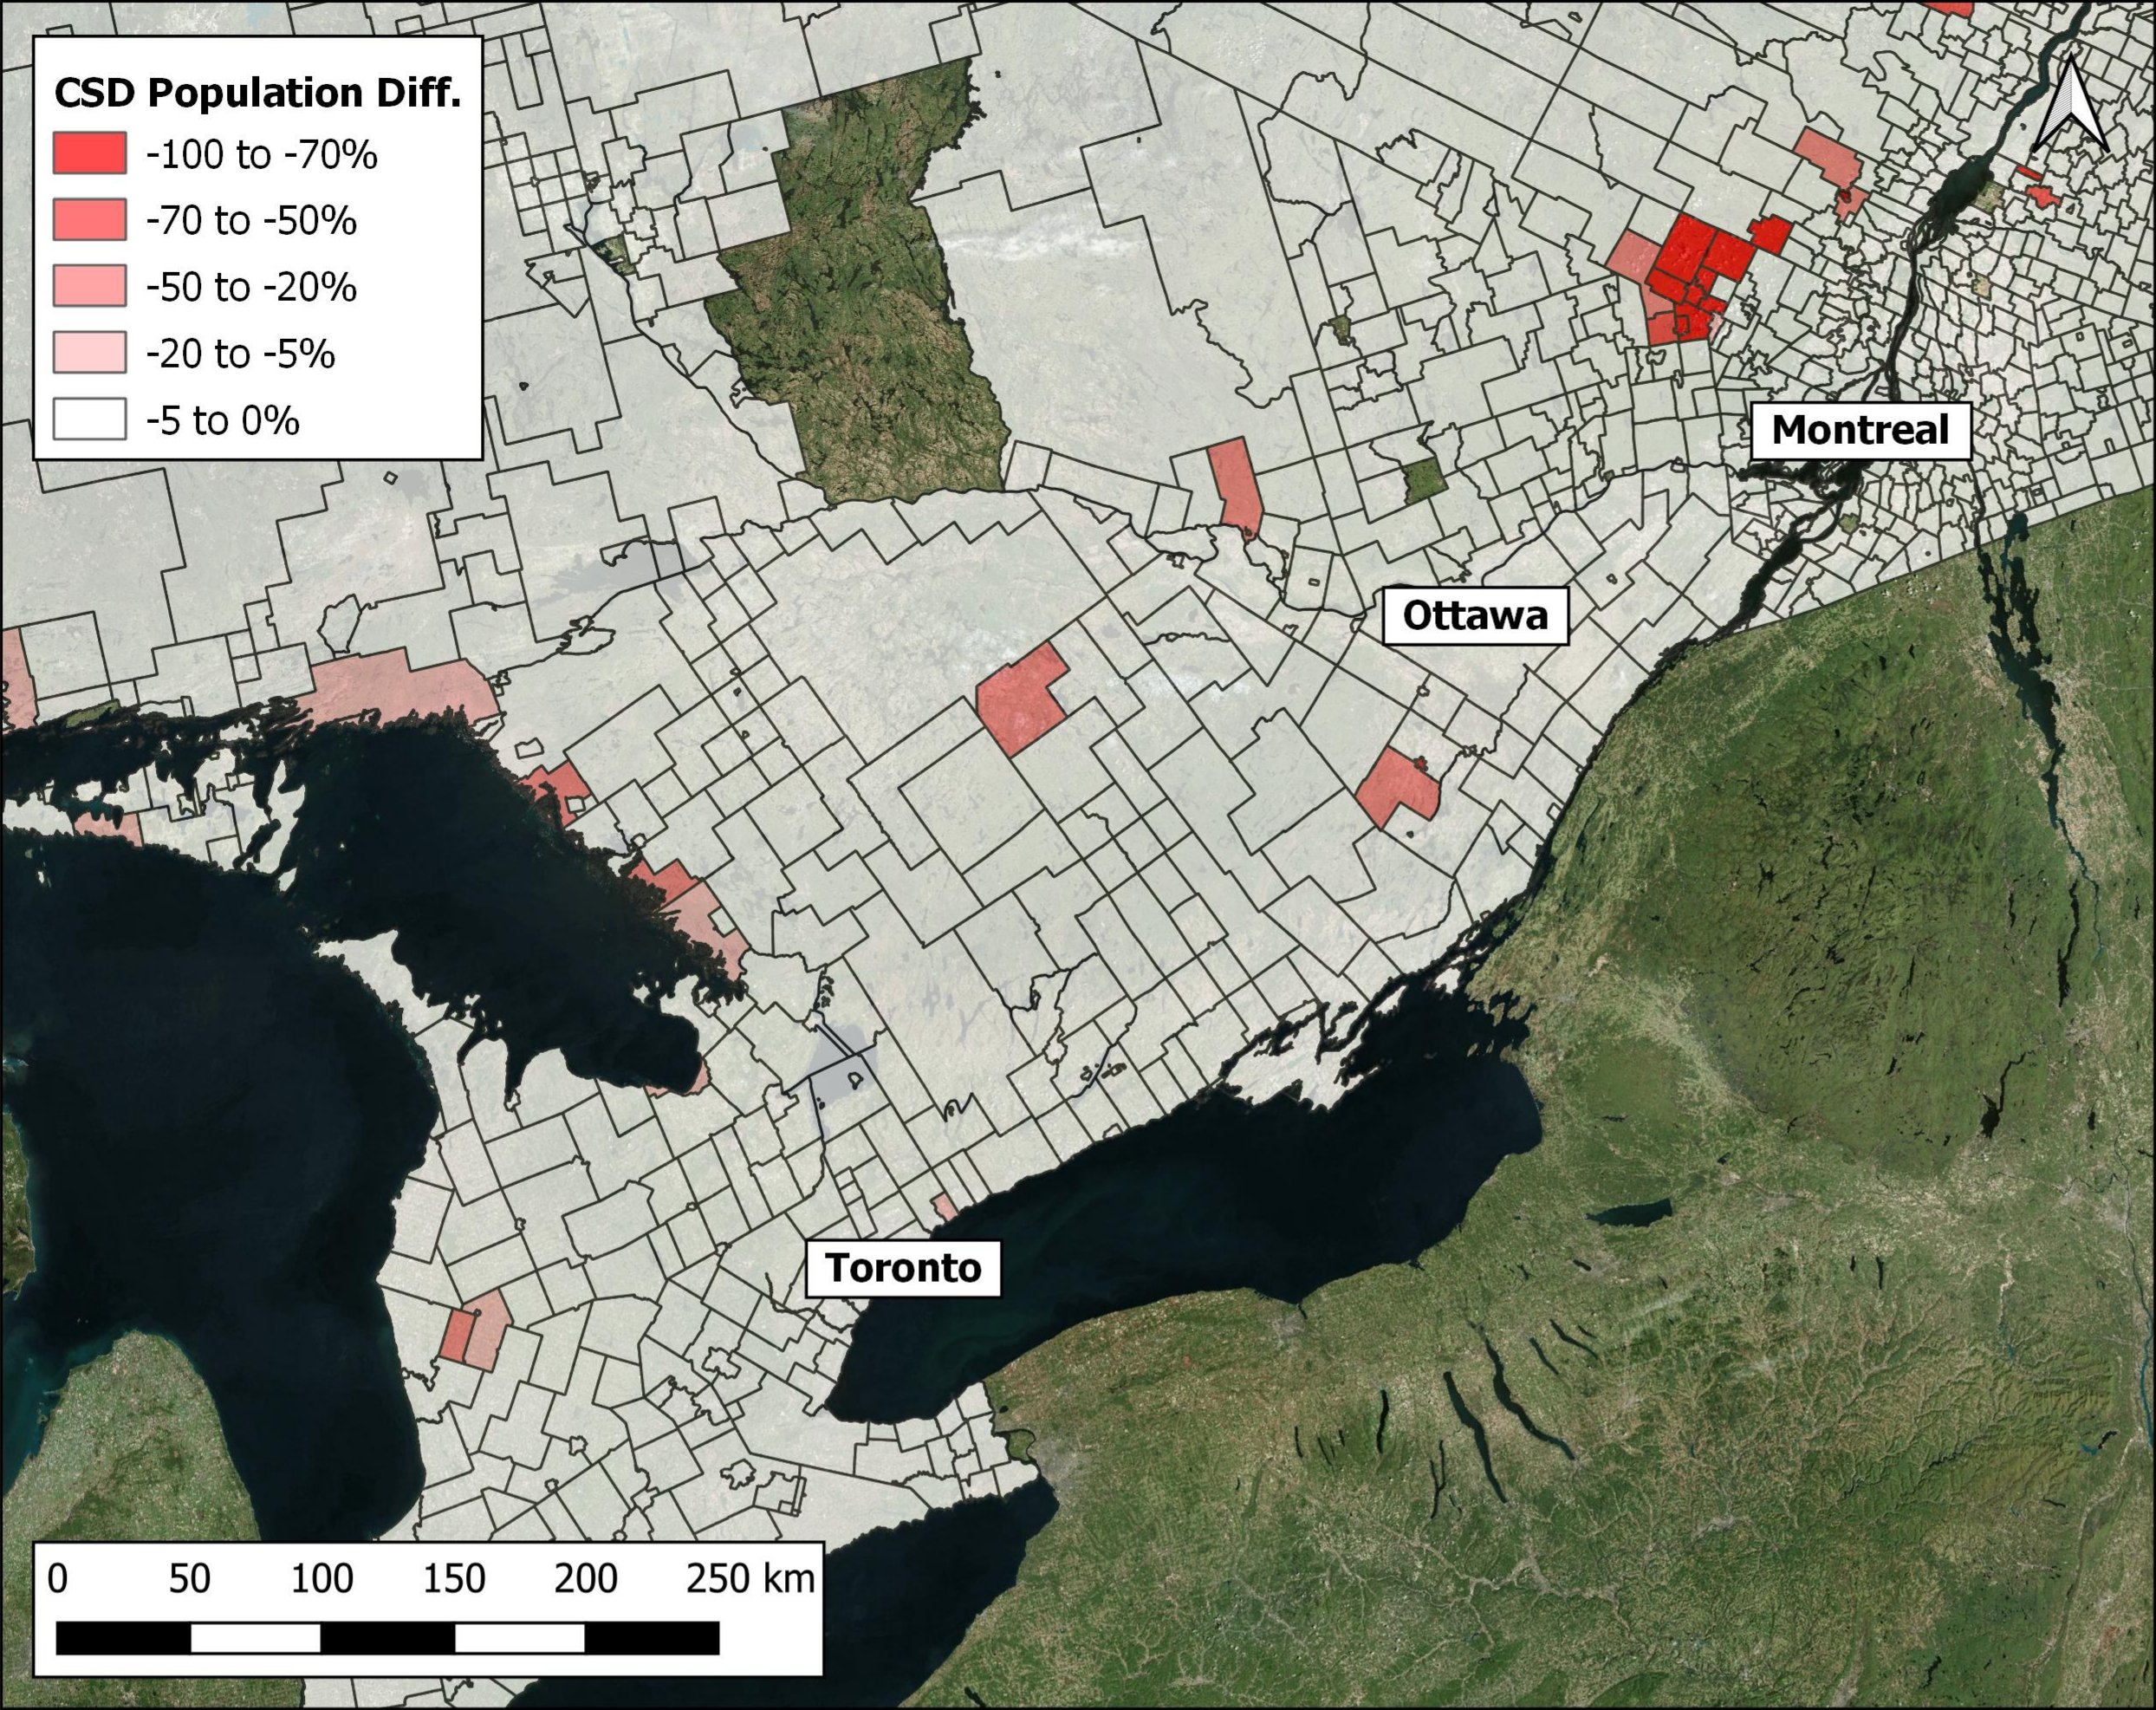
These gaps indicate that there are buildings missing in the original Microsoft Canadian Building Footprints Layer, which was one of the inputs for the Open Building Population Layer. A number of factors could explain this (cloud coverage during satellite imagery capture, quality control, etc.).
5. Opportunities
The same method can be used to evaluate other large-scale building footprint datasets. A building population layer can be recreated from any building footprint data using just a few lines of code, and the back-calculation will indicate where gaps are located in this building footprint data.
The level of the census polygons used in the comparison is critical. This analysis was completed with census sub-divisions to identify areas of concerns at a high-level. However, the back-calculation could also be completed with census dissemination areas or census dissemination blocks to pinpoint areas of concern in more detail within a specific census sub-division. These problematic areas could then be used as priority areas for extraction of new building footprints from satellite imagery to fill the gaps.
6. Interactive map of building gaps for Canada
The interactive map below was created to allow users to quickly identify gaps and limitations in the Open Building Population Layer (Canada). If you plan on using the layer in your project or study, review the data carefully.
The comparison results at the census sub-division level are available for download here: Population difference per CSD for Canada (94.6 MB, uncompressed)
Maxim Fortin
Water Resources Engineer
My professional interests include hydrological and hydraulic modeling, flood mapping and geospatial data analysis.