Open Building Population Layer (Canada) - 2016 - Deprecated
 Open Building Population Layer (Canada)
This data layer based on the 2016 census data is deprecated. The new version based on 2021 census data is available at Open Building Population Layer (Canada) - 2021.
The Open Building Population Layer (Canada) is a personal project by Maxim Fortin. It is not an official Government of Canada data source for building footprints or population distribution. No warranty is given as to the accuracy or completeness of the information provided.
Table of Contents
1. Introduction
This dataset contains population estimates at the building level for all provinces and territories in Canada, calibrated using publicly available census information. This data, along with accompanying code, can be downloaded and used freely under open source licenses.
2. Why this layer was developed
Population density products have long been used to quantify demographic information and to assess relationships with hazards, ecosystems, human health and infrastructure. However, there is currently a gap for a fine-resolution population density product covering all provinces and territories in Canada.
While proprietary datasets presenting this type of information already exist, they can be expensive. The public availability of remote sensing and free open-source data has significantly increased in recent years, making it now easier than ever to develop good population estimates all the way down to the building level, in the public domain.
3. Example
A possible use of the Open Building Population Layer is to assess the exposure of population to flood hazard as part of risk or priority setting assessments. Flood inundation extent layers are combined with a building population layer to evaluate how many people may potentially be exposed to a particular flooding event.
The image below presents an example for a small community located along the Ottawa River in Quebec, where the Open Building Population Layer was overlayed with publicly available historical flood extents (NRCan, 2017).
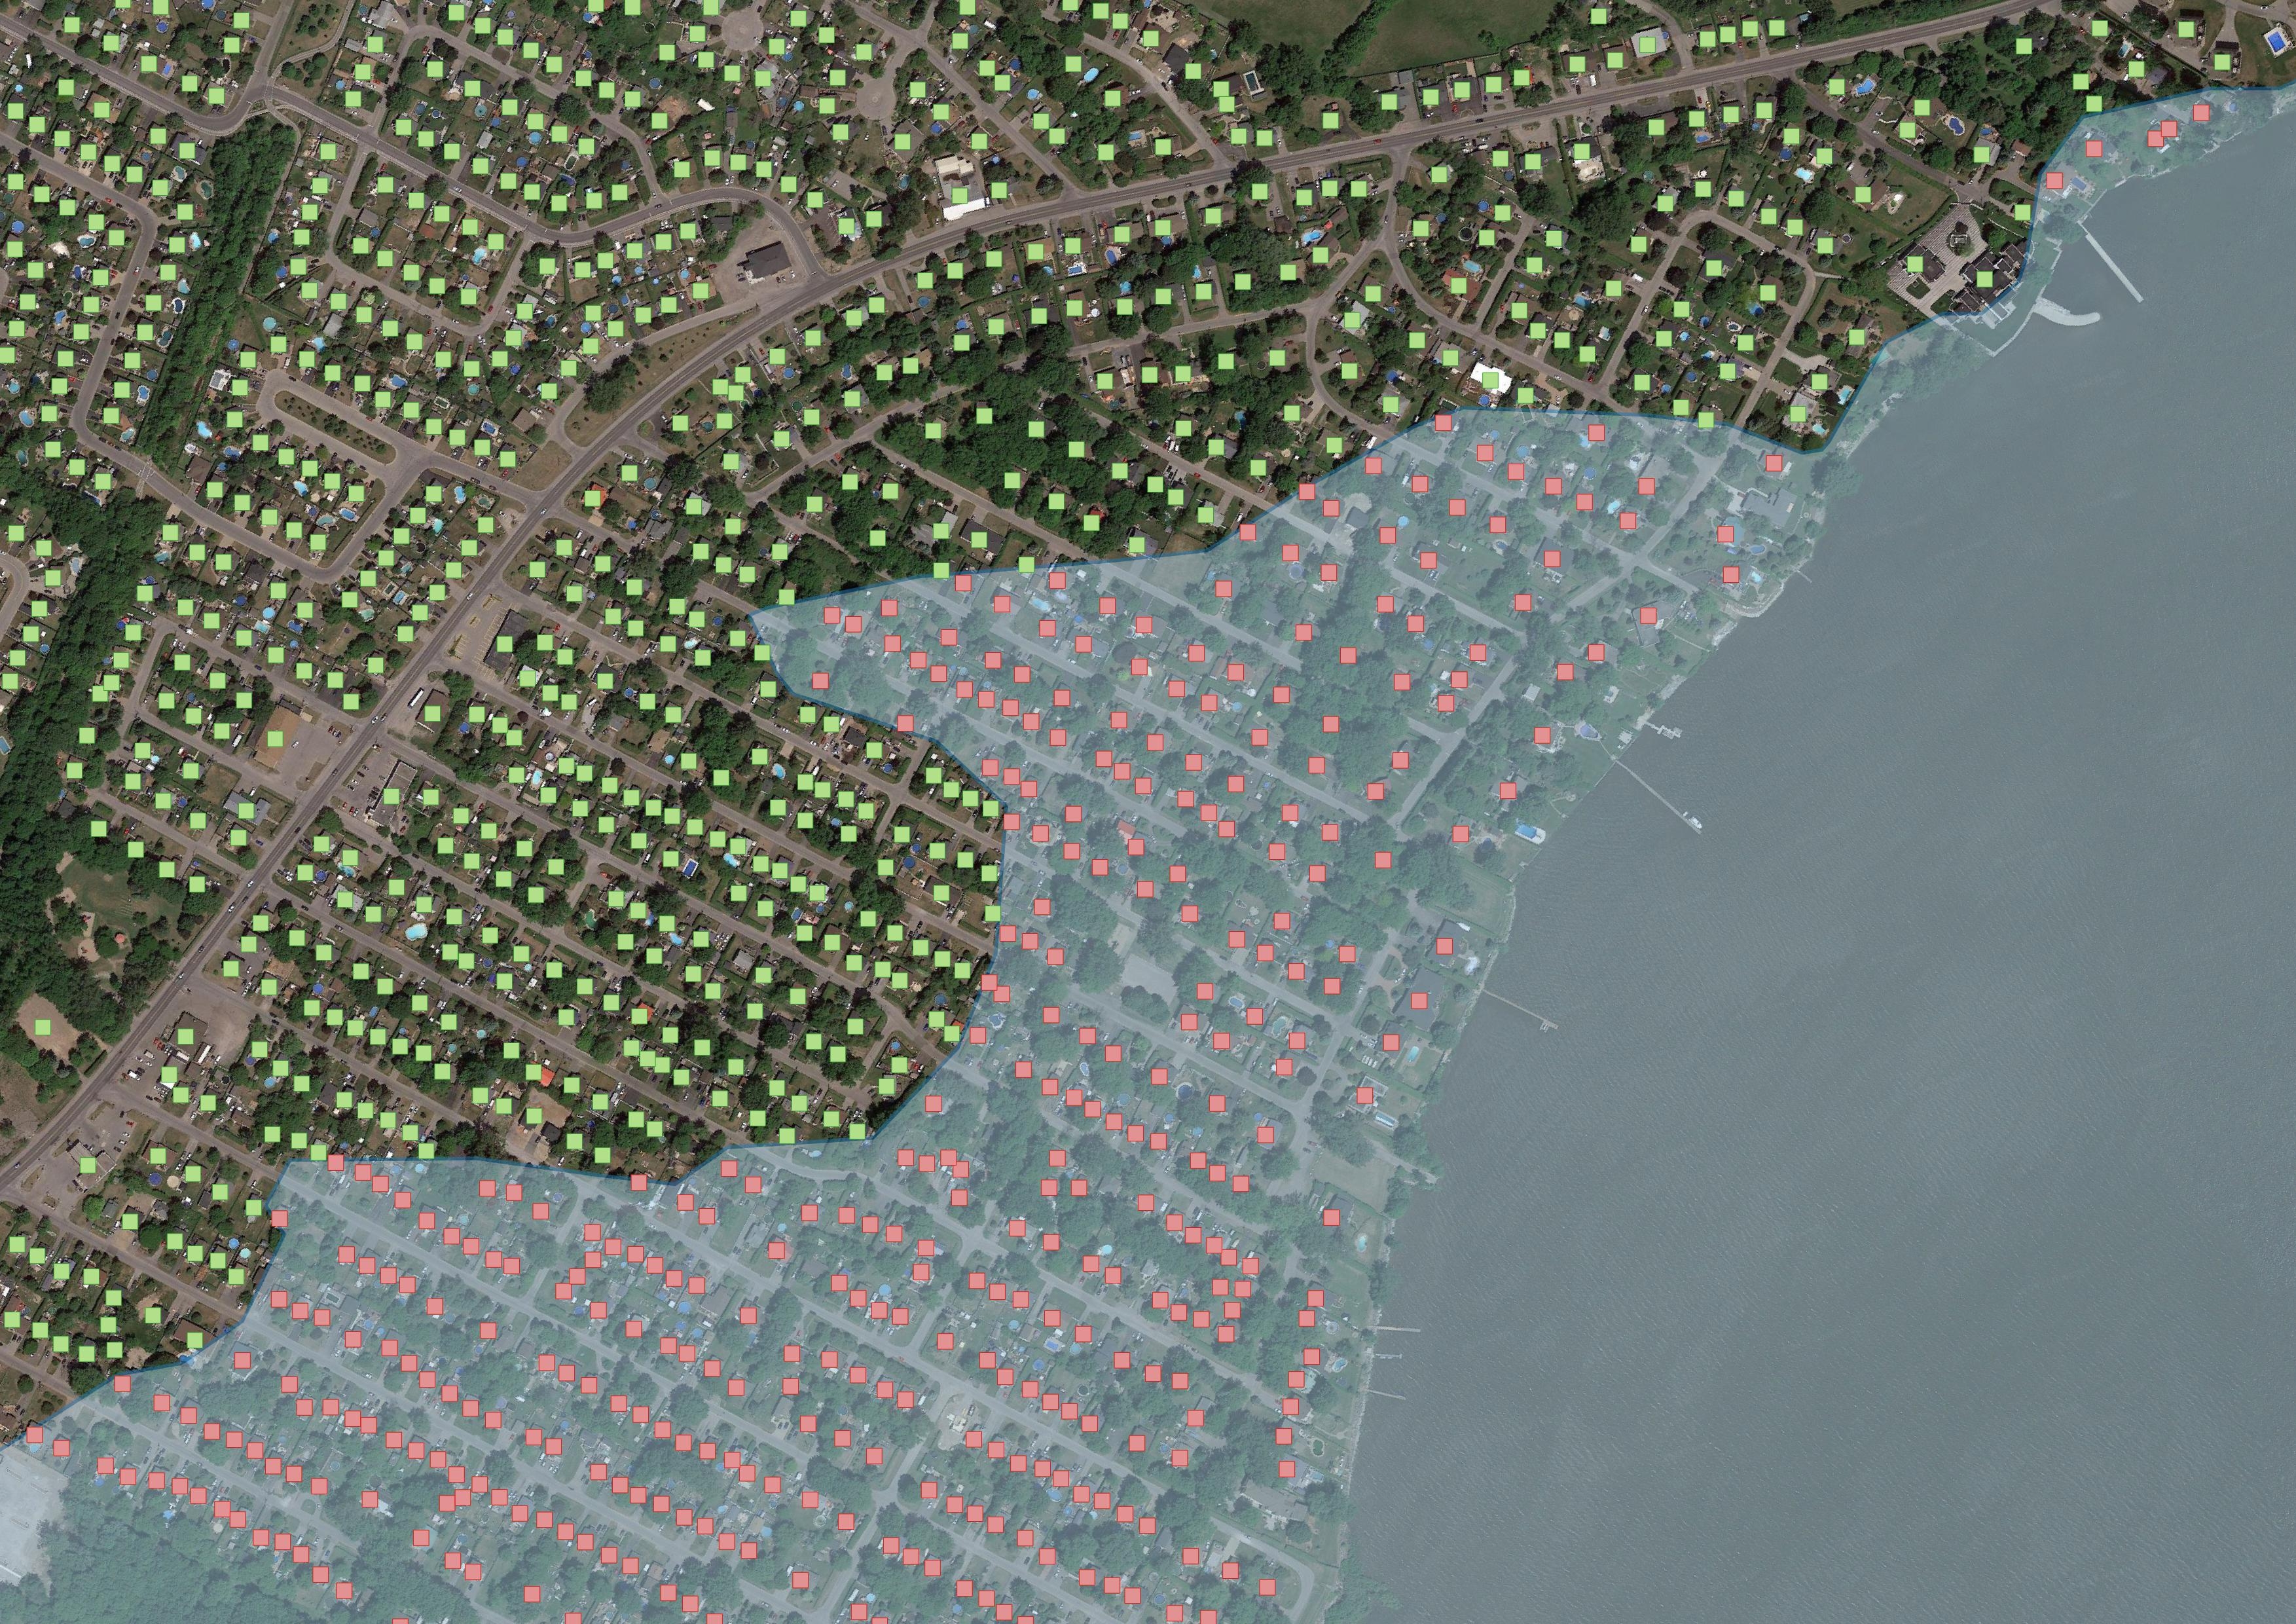
Through this analysis, the population potentially affected by flooding can easily be estimated by calculating a sum of the population for the buildings exposed to the hazard.
4. Data sources for the layer
The Open Building Population Layer (Canada) is calculated using two data sources:
- Microsoft Canadian Building Footprints layer: 11,842,186 computer-generated building footprints developed by Microsoft, freely available for download and use under the Open Data Commons Open Database License (ODbL).
- 2016 Canada Census: population distribution at the smallest available census geographical unit, in this case dissemination areas with 56,590 units distributed across Canada. Geospatial information for dissemination areas is derived from “Population and dwelling counts, for dissemination areas, 2016 Census” and “Dissemination Areas, Cartographic Boundary File – 2016 Census”.
5. Methodology
The building population is estimated in four stages:
- Extract centroid points from building footprints
- Calculate the number of centroid points for each census dissemination area
- Calculate an average population per building for each dissemination area using 2016 census estimates
- Assign the average population back to each building depending on its location within the census areas
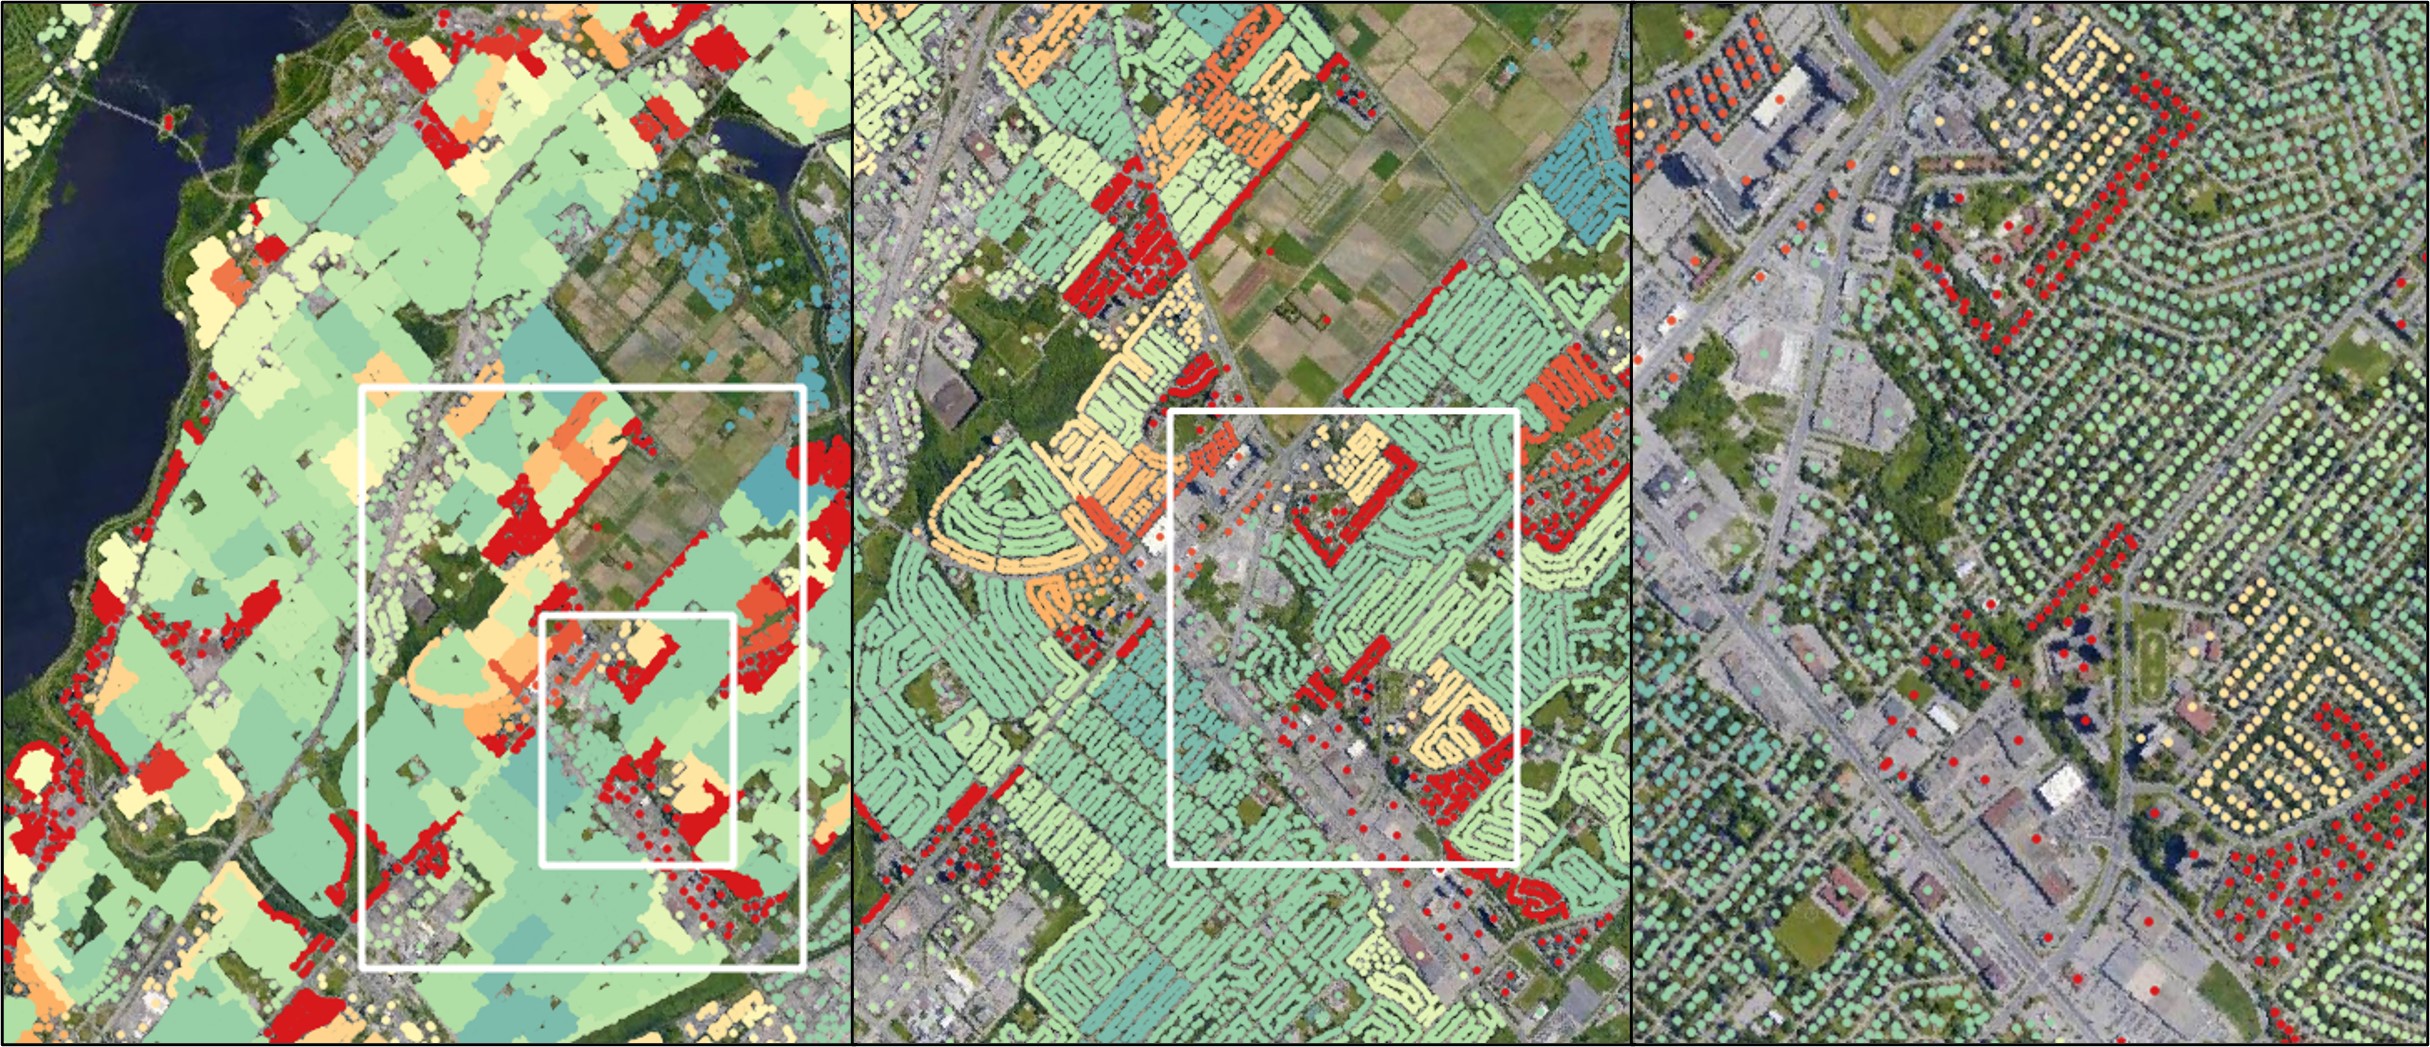
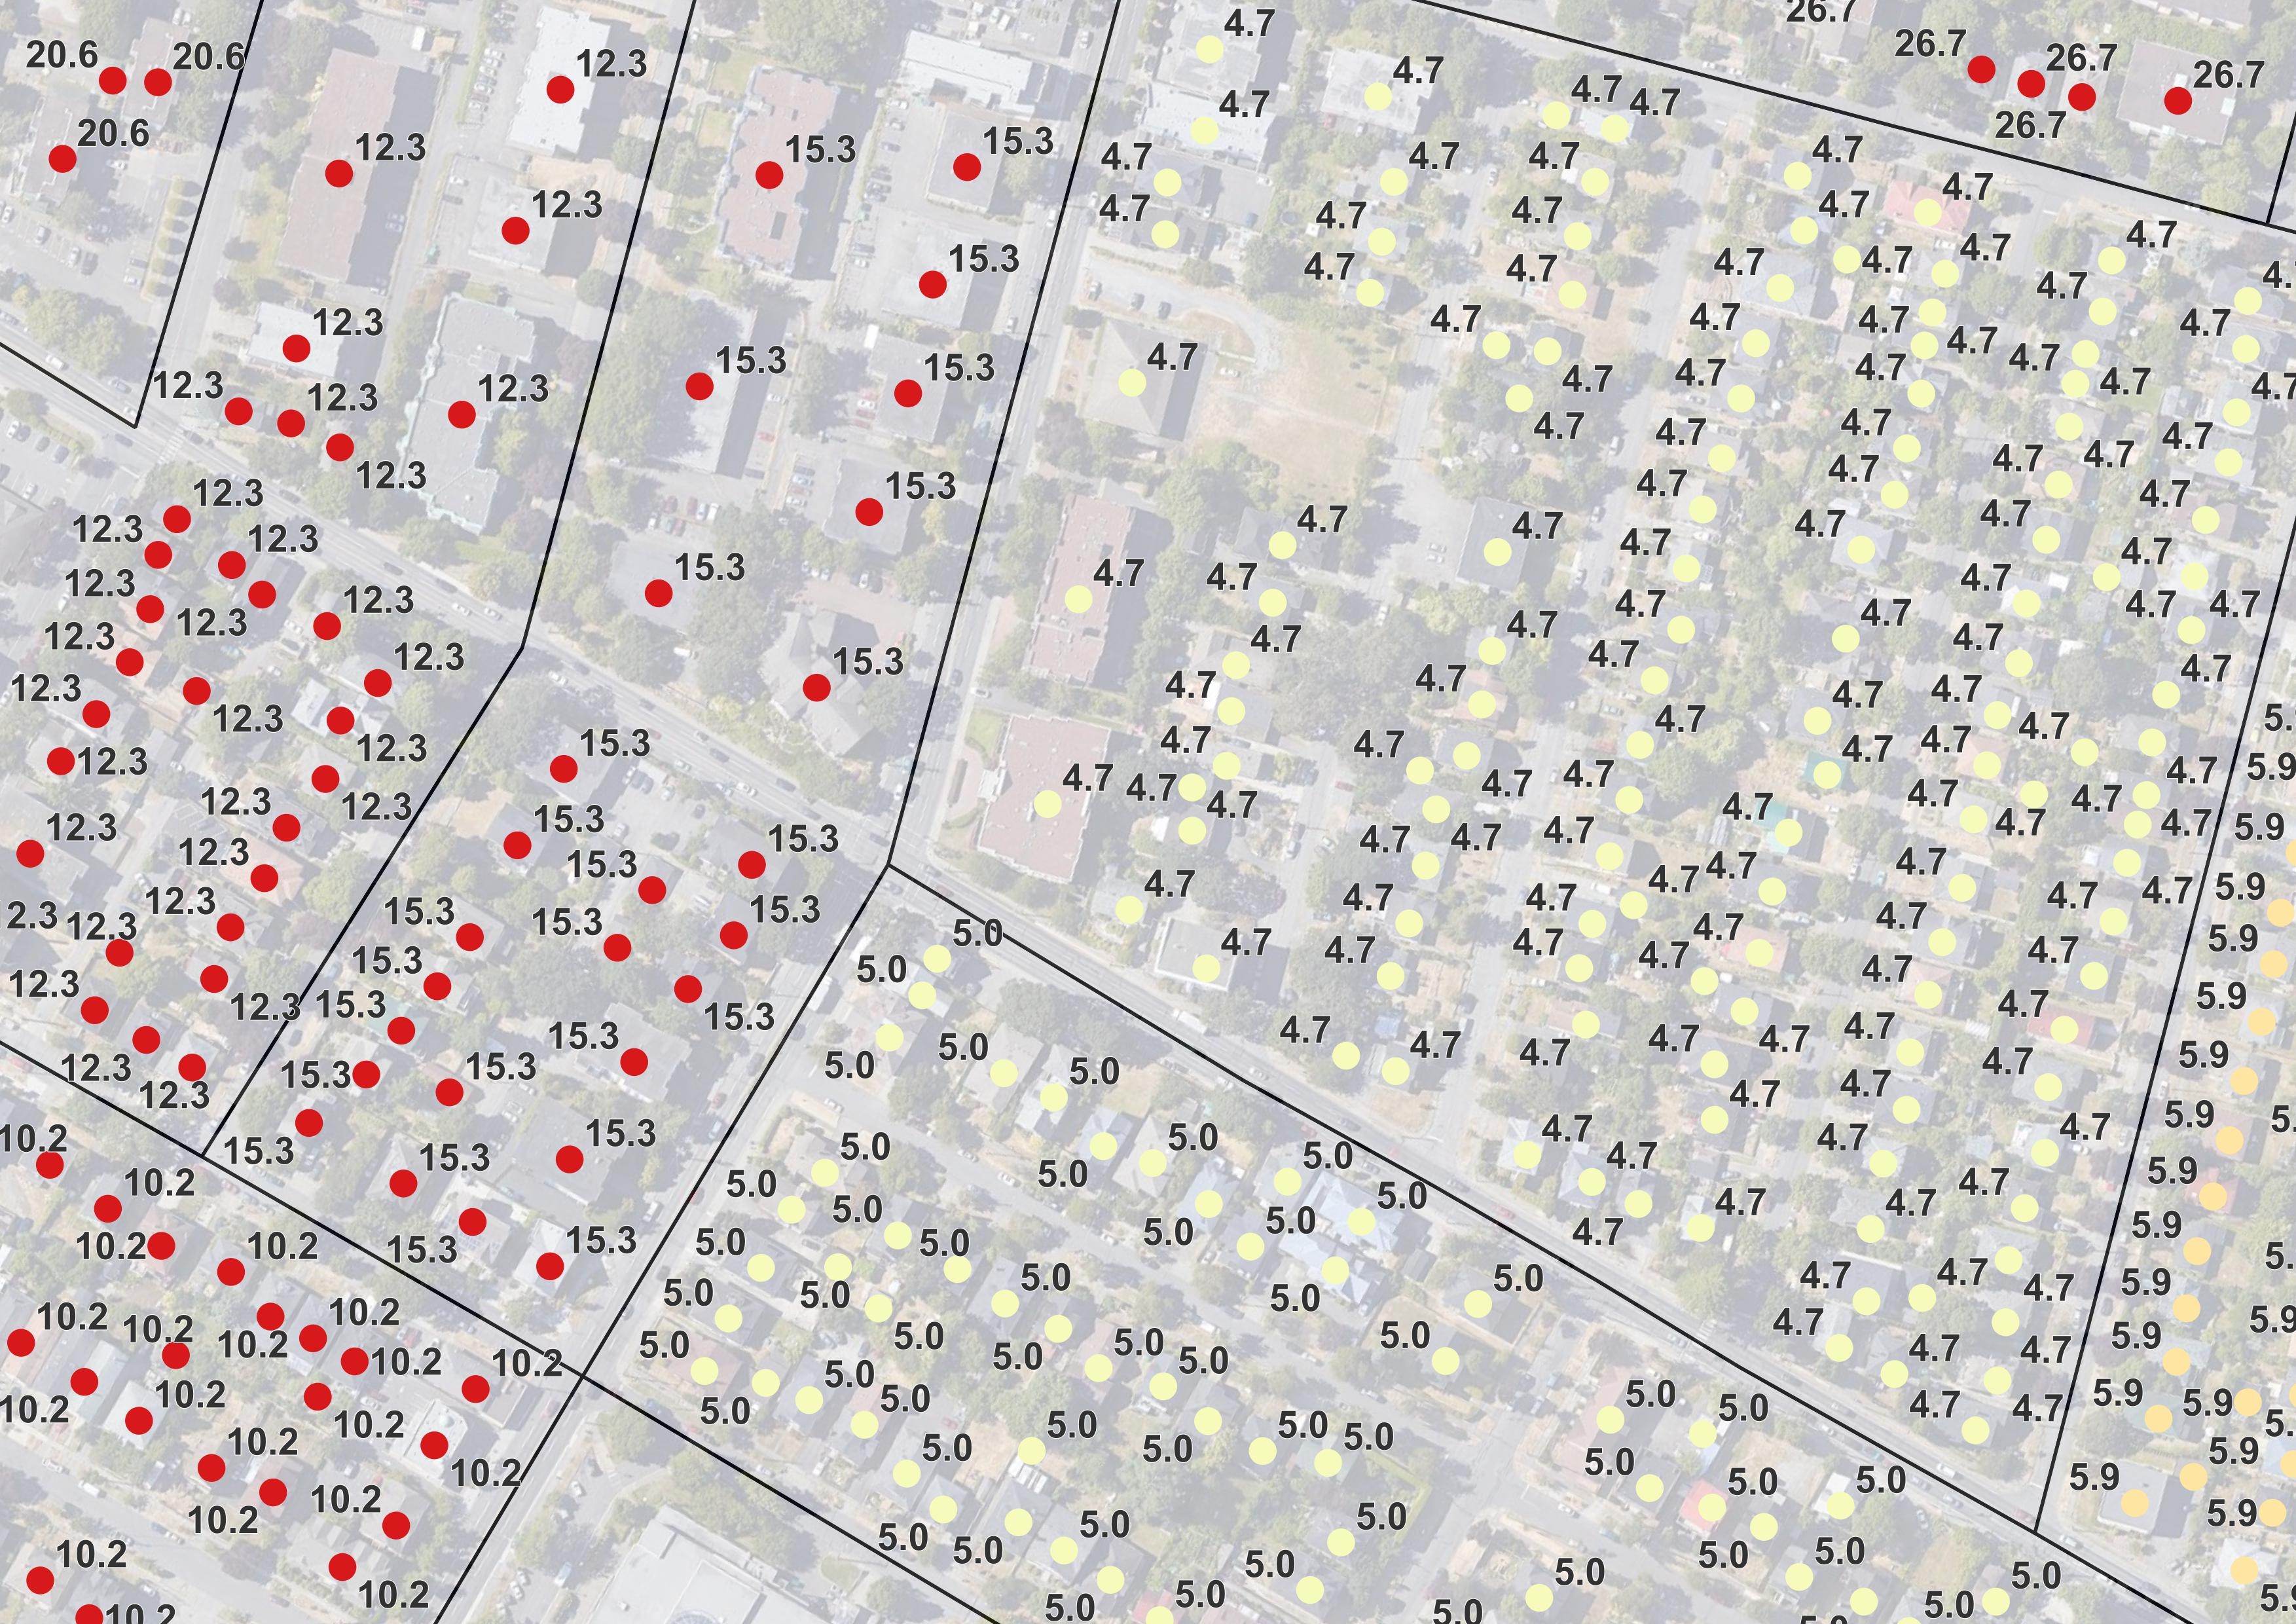
The image below shows an overview of what dissemination areas look like in urban settings, along with an indication of the building population at each point.
The calculation process is automated in Python. The main packages used for geospatial analysis are Geopandas and Pyogrio.
The code is available here in a Github repository.
6. Building population files (beta version)
The following files are available for download in zipped geopackage format (EPSG:3978 coordinate reference system).
This data layer based on the 2016 census data is deprecated. The new version based on 2021 census data is available at Open Building Population Layer (Canada) - 2021.
| Province/Territory | Number of Buildings | Zipped MB |
|---|---|---|
| Alberta | 1,777,439 | 153 |
| British Columbia | 1,359,628 | 119 |
| Manitoba | 632,982 | 55 |
| New Brunswick | 350,989 | 30 |
| Newfoundland and Labrador | 255,568 | 21 |
| Northwest Territories | 13,161 | 1 |
| Nova Scotia | 402,358 | 35 |
| Nunavut | 2,875 | 1 |
| Ontario | 3,781,847 | 334 |
| Prince Edward Island | 76,590 | 6 |
| Quebec | 2,495,801 | 221 |
| Saskatchewan | 681,553 | 59 |
| Yukon | 11,395 | 1 |
7. Limitations and potential areas of improvement
If you find errors in the dataset or have ideas for potential contributions, please don’t hesitate to contact me using the contact form accessible from the site menu.
The following elements have been identified as limitations and potential areas of improvement.
Population detail: The dataset provides an overview of the population density within a census dissemination area, averaged over the number of buildings located within that dissemination area. The building population layer can be used for high-level assessments, but should not be used as a tool to try and directly assess the number of people living in specific building units.
Gaps in building layer: The Microsoft Bing is one of the most complete, if not the most complete, building footprint layer publicly available. However, as documented in the Data QA/QC section, there are still limited populated areas where footprints are missing. When a gap in coverage is larger than a given dissemination area, the population from that census unit cannot be assigned to any buildings. This is the main reason why the building population estimates are slightly lower than the census population data (-0.56% across the county). Potential solutions include the combination of multiple building footprint data sources to fill the gaps.
Types of buildings: No differentiation is made with regards to the type of building (residential, commercial, industrial, institutional, etc.). As such, population is distributed evenly across all buildings, including non-residential buildings. Additional information related to zoning and land use could be integrated in the future to account for that aspect. Some researchers also investigated the use of additional parameters to allocate the population distribution, such as relationships between the surface area of the building footprint and the population.
Dissemination areas: It should be noted that there is a census unit smaller than dissemination areas called dissemination blocks (a dissemination area is composed of multiple dissemination blocks). However, the population for dissemination blocks is not readily available everywhere in Canada. It would be possible to do a “stitching” of the dissemination blocks that are publicly available, along with the dissemination areas where the dissemination blocks are not available, in order to improve the overall resolution of the population data.
Year of census data: The layer was calculated using the 2016 census data. A new census was conducted in 2021 by Statistics Canada, however detailed results are not available yet. Official release is expected in 2022, and a new version of the Open Building Population Layer (Canada) will be calculated using the new census data.
8. License and attribution
The Open Building Population Layer (Canada) has been produced by Maxim Fortin as open and free data.
Dataset license
The dataset is released under the Open Database License (ODbL). This license allows you to freely use, distribute, and modify the dataset provided you attribute the source and share any modifications under the same license.
When using the dataset, please attribute as follows:
Fortin, Maxim (2022): Open Building Population Layer - Canada, derived from open-source computer-generated footprints and 2016 census data, URL: https://www.maximfortin.com/project/obpl-ca-2016/
No warranty is given as to the accuracy or completeness of the information provided. While the dataset provides estimates of population for each building in Canada, please note that these are derived approximations and do not represent exact population counts. Use caution when interpreting and utilizing the data for decision-making purposes.
Code license
The code is released under the Apache 2.0 License. This license allows you to freely use, distribute, and modify the code for both commercial and non-commercial purposes, with limited liability and warranty.
When using the code, please attribute as follows: Fortin, Maxim (2022): Python code for the Open Building Population Layer - Canada, derived from open-source computer-generated footprints and 2016 census data, URL: https://www.maximfortin.com/project/obpl-ca-2016/
No warranty is given as to the accuracy or completeness of the information provided. We provide no warranties and assume no responsibility for any liabilities associated with the use of this code.
Maxim Fortin
Water Resources Engineer
My professional interests include hydrological and hydraulic modeling, flood mapping and geospatial data analysis.