Open Building Population Layer (Canada) - 2021
 Open Building Population Layer (Canada)
The Open Building Population Layer (Canada) is a personal project by Maxim Fortin. It is not an official Government of Canada data source for building footprints or population distribution. No warranty is given as to the accuracy or completeness of the information provided.
Table of Contents
1. Introduction
This dataset contains population estimates at the building level for all provinces and territories in Canada, calibrated using publicly available census information. This data, along with accompanying code, can be downloaded and used freely under open-source licenses.
2. Why this layer was developed
Population density products have long been used to quantify demographic information and to assess relationships with hazards, ecosystems, human health and infrastructure. However, there is currently a gap for a fine-resolution population density product covering all provinces and territories in Canada.
While proprietary datasets presenting this type of information already exist, they can be expensive. The public availability of remote sensing and free open-source data has significantly increased in recent years, making it now easier than ever to develop good population estimates all the way down to the building level, in the public domain.
3. Potential use cases
Example 1: Floodplain population exposure
In this example, the data layer is used to assess the exposure of population to flood hazard as part of risk or priority setting assessments. Flood inundation extent layers are combined with the building population layer to approximate how many people may potentially be exposed to a particular flooding event.
The image below presents an example for a small community in Ontario, where the Open Building Population Layer was overlayed with a fictional riverine flood extent.
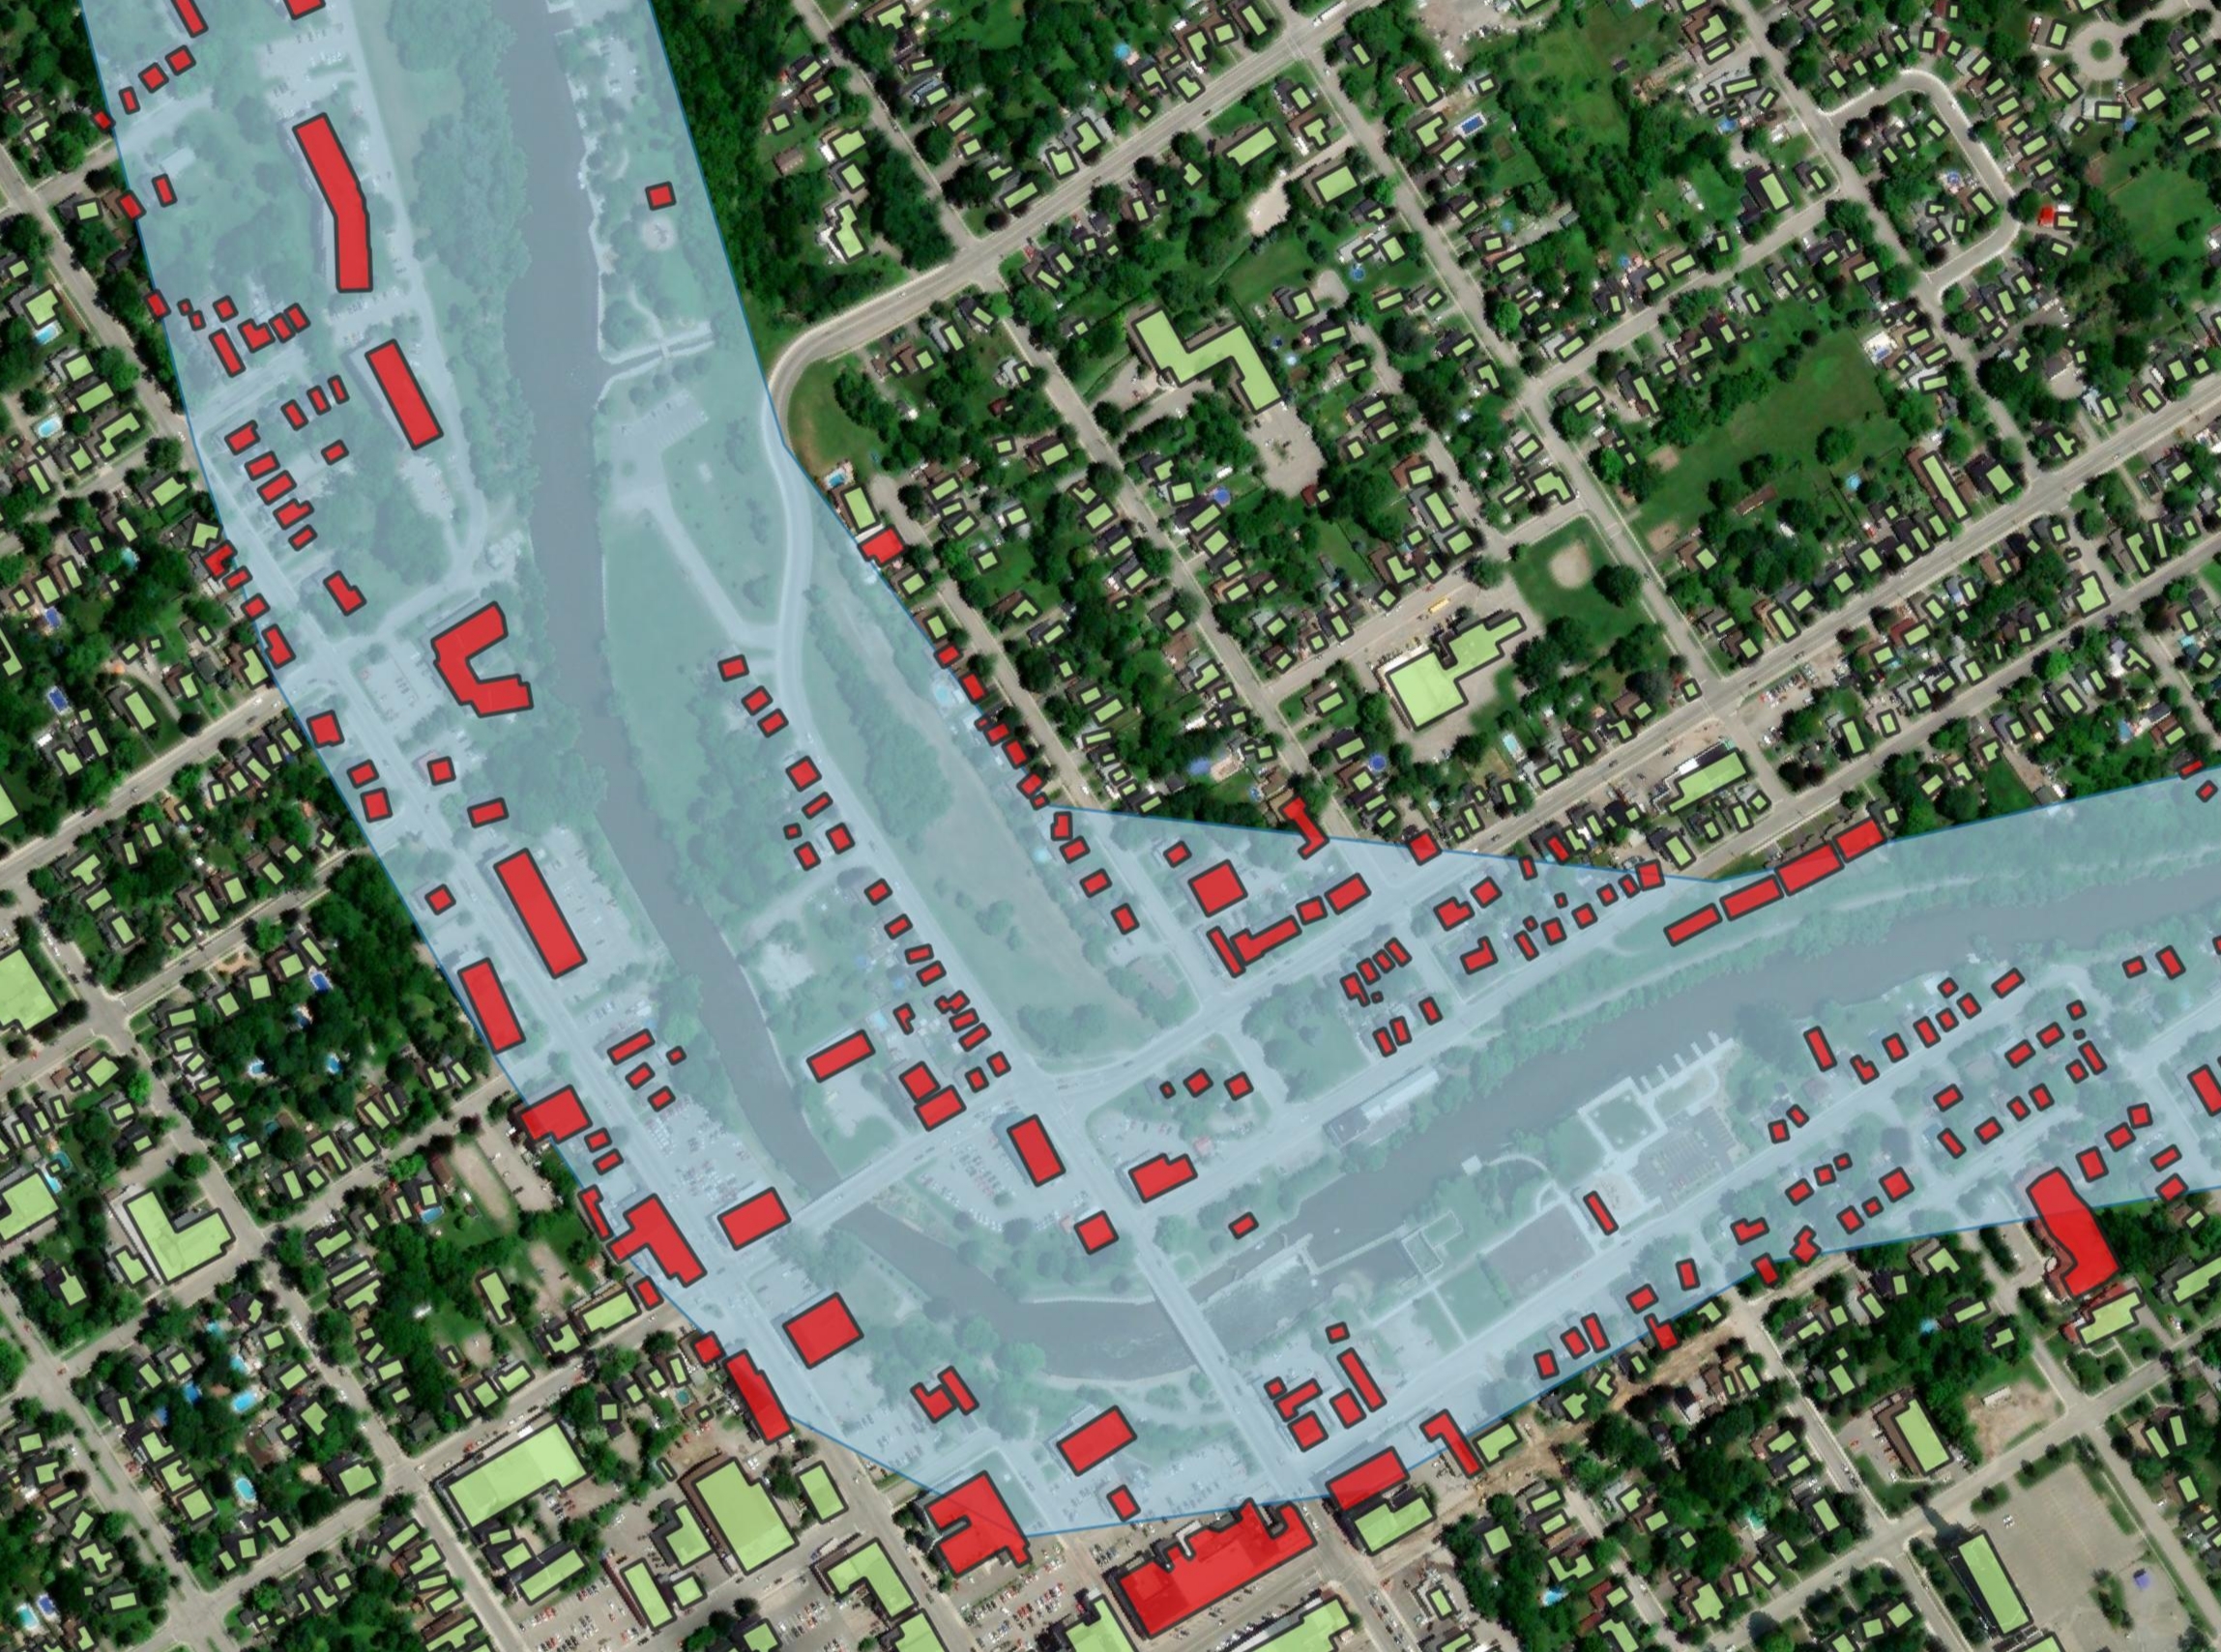
Through this analysis, the population potentially affected by flooding can easily be approximated by calculating a sum of the population for the buildings exposed to the flood hazard.
Example 2: Population coverage for new transit line
In this example, the data layer is used to estimate population living within a given radius of a new proposed transit line.
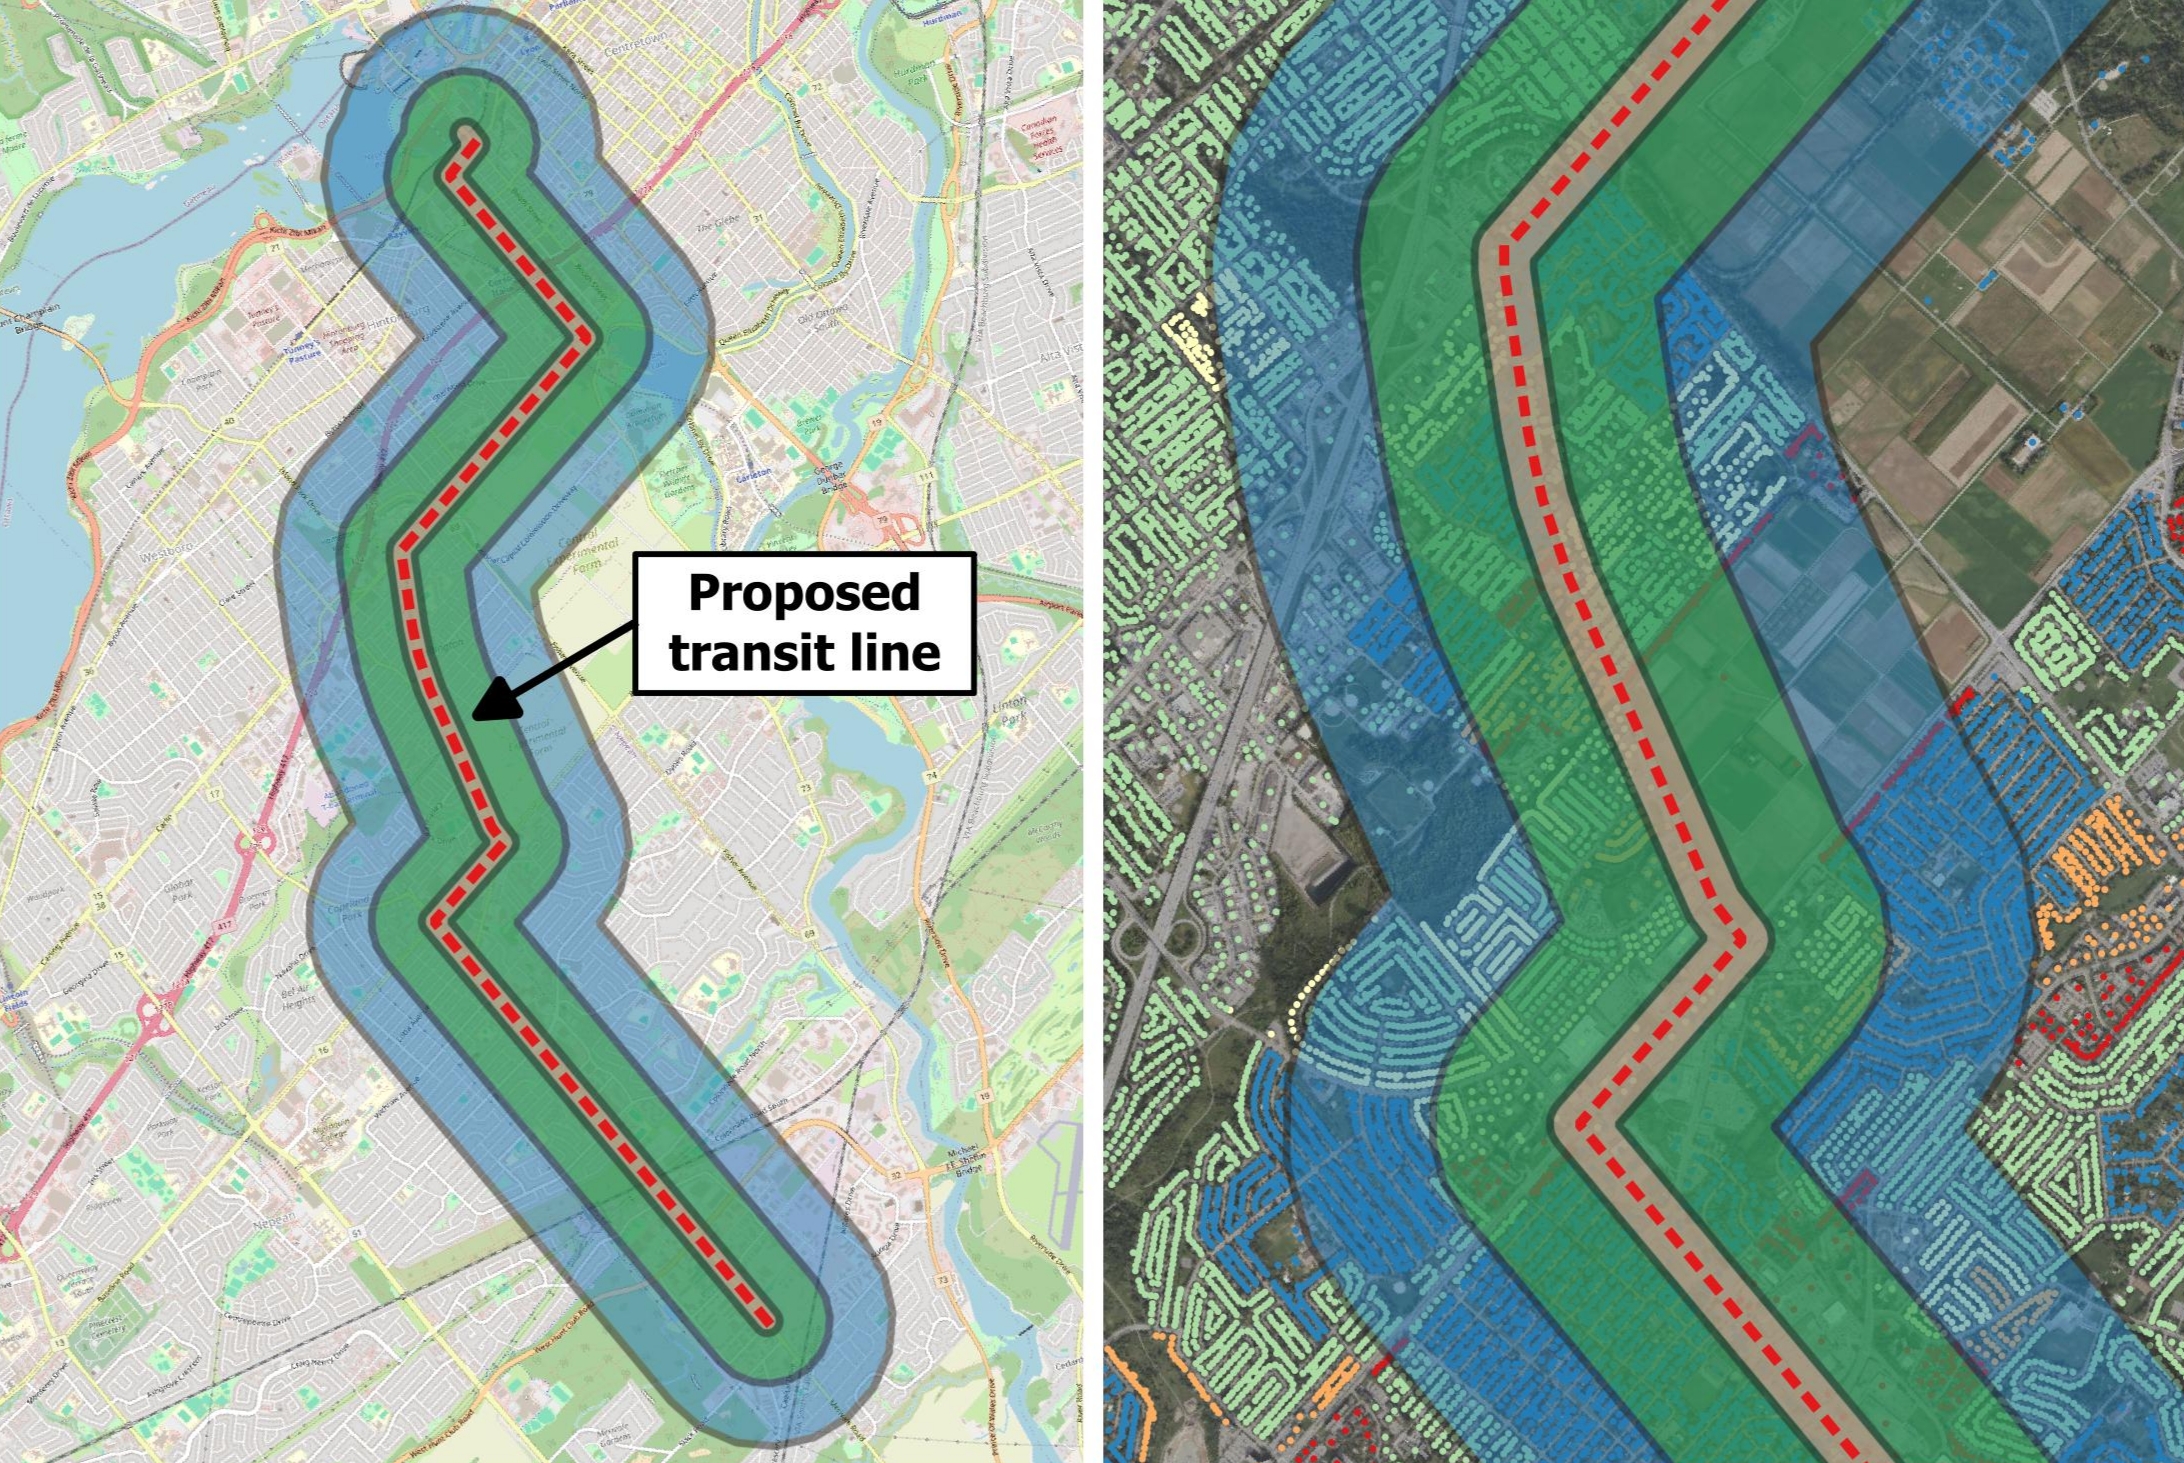
Buffers of 100 m, 500 m and 1,000 m were created around the proposed transit line. These buffers were then intersected with the Open Building Population Layer to estimate how many people may be covered at various distances for this fictional transit scenario.
4. Data sources for the layer
The Open Building Population Layer (Canada) is calculated using two data sources:
- Microsoft Bing Maps Global Building Footprints: 12,336,057 computer-generated building footprints developed by Microsoft, freely available for download and use under the Open Data Commons Open Database License (ODbL). Each footprint includes a building height estimate from Bing Maps imagery between 2014 and 2023 including Maxar and Airbus.
- 2021 Canada Census: Population distribution at the smallest available census geographical unit, in this case dissemination areas with 57,932 census units across Canada. Geospatial information for dissemination areas is derived from “Census Profile, 2021 Census of Population” and “Dissemination Areas, Cartographic Boundary File – 2021 Census”. Census sub-division and census division units are also used to approximate population in rare cases where population is not provided at the dissemination area level (178 units).
5. Methodology
The building population is estimated in four stages:
- Calculate the number of buildings for each census dissemination area, census subdivision and census division
- Calculate an average population per building ratio for each census unit using 2021 census estimates
- Assign the average population back to each building depending on its location within the census areas. Dissemination area population ratios are prioritized, followed by census subdivision and census division ratios when no data is available.
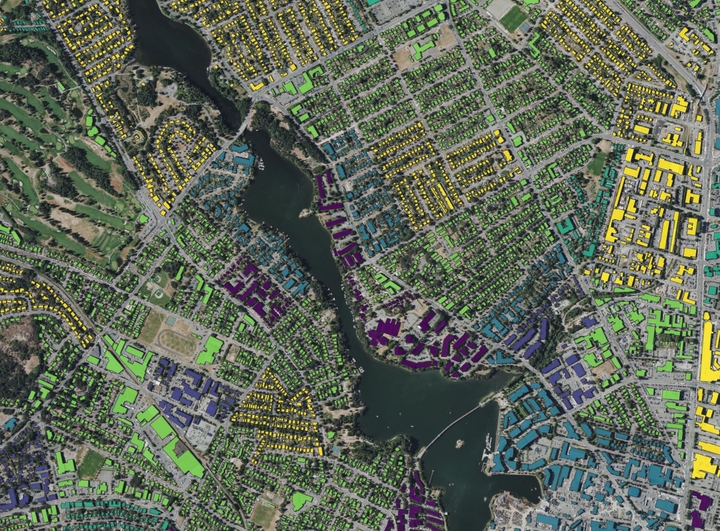
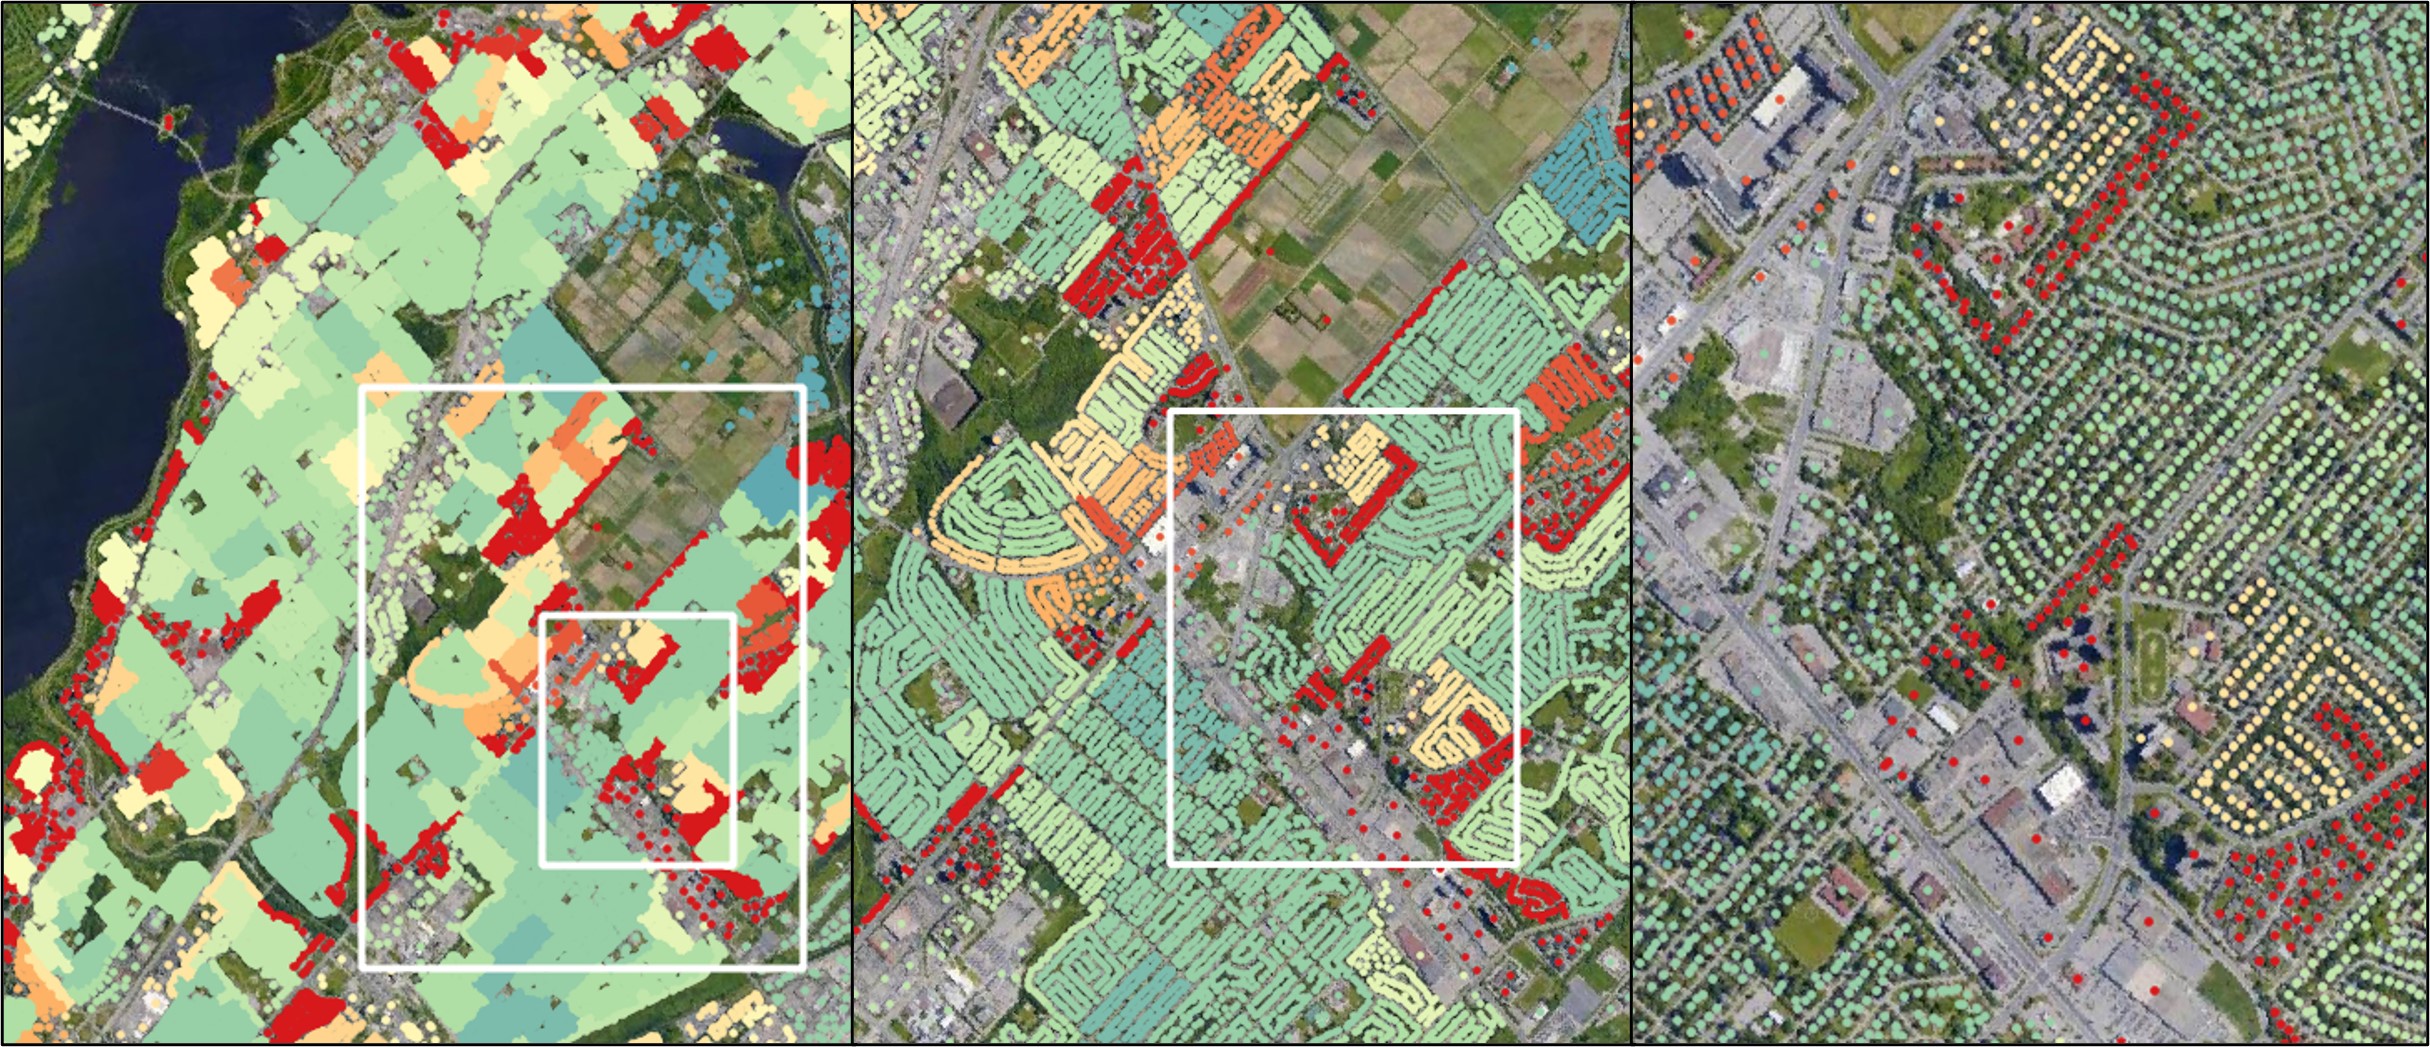
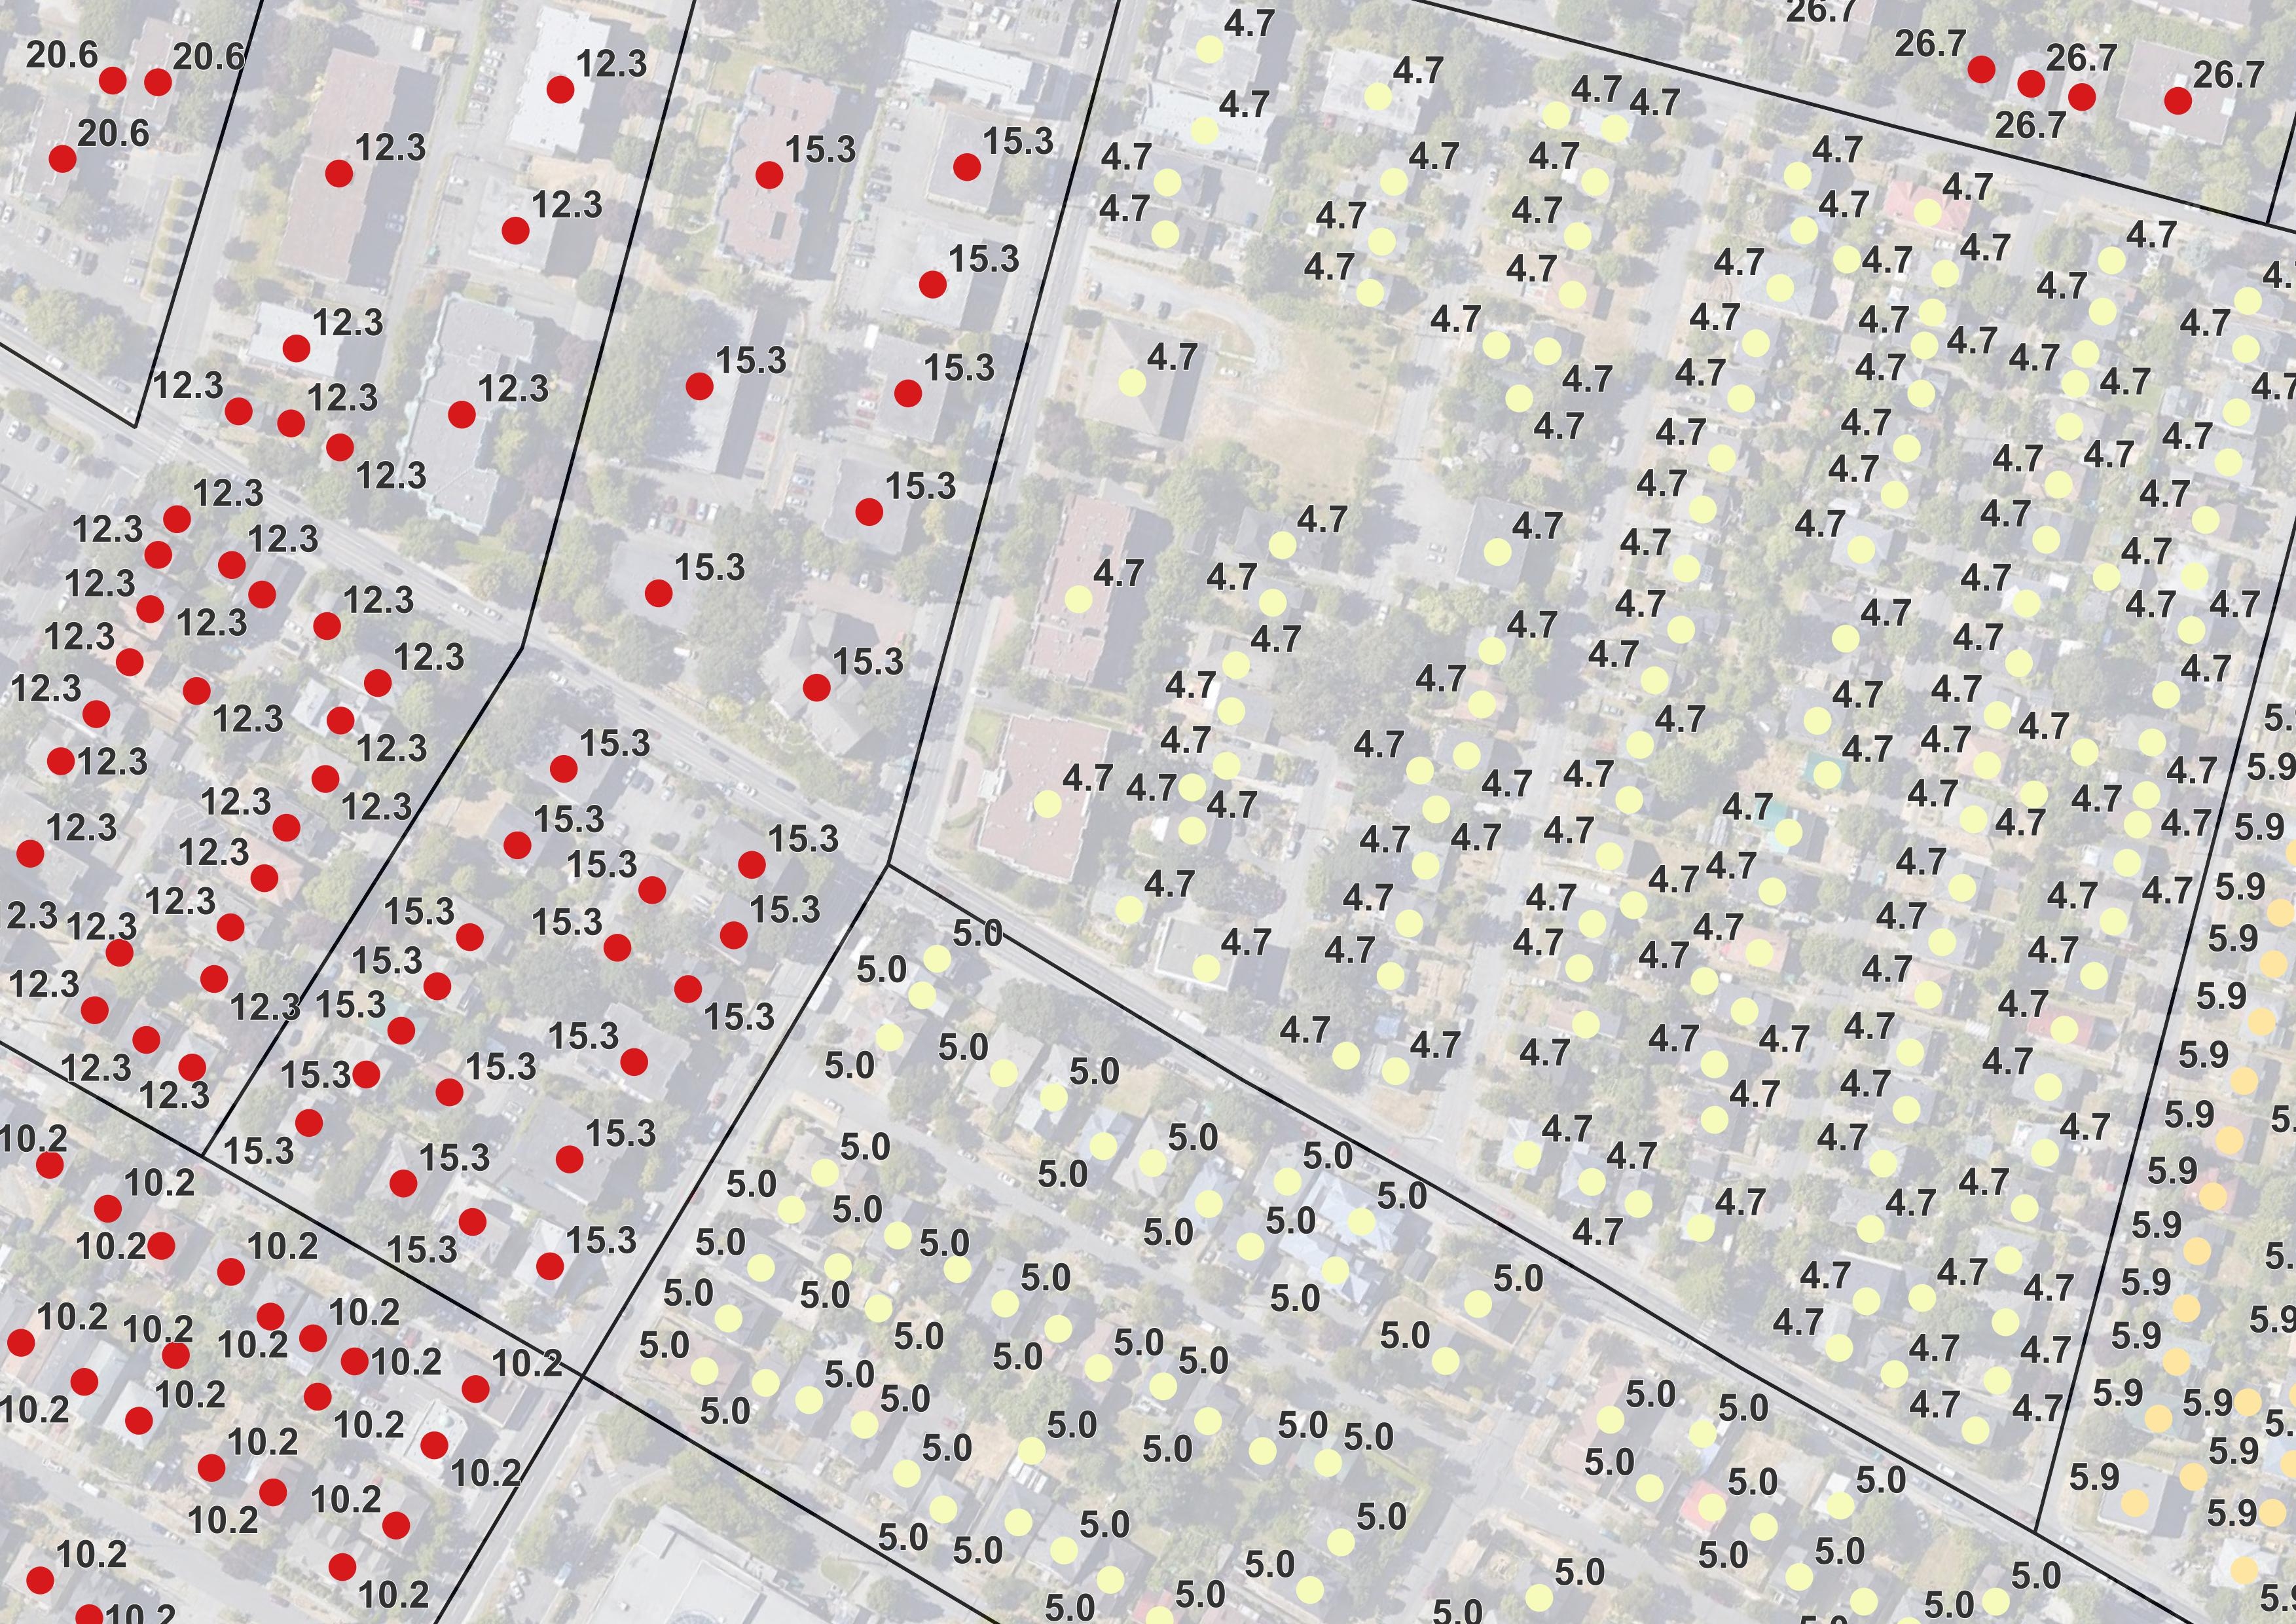
The image below shows an overview of what dissemination areas look like in urban settings, along with an indication of the building population at each point.
The calculation process is automated in Python. The main packages used for the geospatial analysis are Geopandas and Pyogrio.
The code is available here in a Github repository.
6. Data dictionary
Data fields provided with this data layer are described below:
- BLDG_ID: Building ID is an 8-digit unique identifier assigned to each building in the dataset, sourced internally.
- HEIGHT: Height represents the average height of buildings, measured in meters (m), sourced from the Microsoft Bing Maps Global Building Footprints. Structures without height estimates are populated with a -1.
- DAUID: Dissemination Area Unique Identifier (DAUID) is a 9-digit code identifying each dissemination area, sourced from Statistics Canada.
- DA_RATIO: DA Ratio is a numerical value representing the ratio of population to number of buildings, sourced internally.
- CSDUID: Census Subdivision Unique Identifier (CSDUID) is a 7-digit code identifying each census subdivision, sourced from Statistics Canada.
- CSD_RATIO: CSD Ratio is a numerical value representing the ratio of building population to census subdivision population, sourced internally.
- CDUID: Census Division Unique Identifier (CDUID) is a 6-digit code identifying each census division, sourced from Statistics Canada.
- CD_RATIO: CD Ratio is a numerical value representing the ratio of building population to census division population, sourced internally.
- PRUID: Province or Territory Unique Identifier (PRUID) is a 2-digit code identifying each province or territory, sourced from Statistics Canada.
- PT_RATIO: PT Ratio is a numerical value representing the ratio of building population to province or territory population, unitless, sourced from Statistics Canada.
- BLDG_POP: Estimated building population for that feature, sourced from either DA_RATIO, CSD_RATIO or CD_RATIO.
- POP_SOURCE: Population Source indicates the source of the population ratio used to estimate building population, either DA_RATIO, CSD_RATIO or CD_RATIO.
7. Data sample (interactive web maps)
Building footprints
Building points
8. Improvements since previous version
The Open Building Population Layer for Canada was updated in March 2024 to consider new census data releases as well as methodology improvements:
- Latest census data (2021): Population estimates are now based on the latest census data release in Canada. The 2021 Canadian Census has a reference date of May 11, 2021. It recorded a total population of 36,991,981, a 5.2% increase from 2016 (Statistics Canada, 2022).
- Reduced data gaps: The processing algorithm was improved to consider population ratios at the census subdivision for the few dissemination areas where no population is available. When estimates are not available with census subdivisions, census divisions are used as last resort. The source of data is specified along with the population estimate for each building in the dataset. The previous data layer had gaps in data for 178 dissemination areas where no population was provided by Statistics Canada.
- Building points and footprints: The building population layer is now released in two versions: points and footprints (polygons). The previous data layer only included point features, based on the centroid point of each building footprint.
- QA/QC data layer: The building population layer is released along with a national dataset produced at the census subdivision indicating areas where there are deficiencies in building footprint coverage. This additional QA/QC data layer can be used by practitioners to assess the quality of the data in their areas of interest.
9. Building population files
The following files are available for download in zipped geopackage format (EPSG:3978 coordinate reference system).
File packages are provided for each province and territory, along with a complete country-wide package.
Building footprints
| Province/Territory | Zipped MB |
|---|---|
| Alberta | 199 |
| British Columbia | 183 |
| Manitoba | 73 |
| New Brunswick | 39 |
| Newfoundland and Labrador | 26 |
| Northwest Territories | 1 |
| Nova Scotia | 42 |
| Nunavut | 1 |
| Ontario | 478 |
| Prince Edward Island | 8 |
| Quebec | 301 |
| Saskatchewan | 73 |
| Yukon | 1 |
| Canada (all) | 1,390 |
Building points
| Province/Territory | Zipped MB |
|---|---|
| Alberta | 86 |
| British Columbia | 75 |
| Manitoba | 31 |
| New Brunswick | 17 |
| Newfoundland and Labrador | 12 |
| Northwest Territories | 1 |
| Nova Scotia | 19 |
| Nunavut | 1 |
| Ontario | 207 |
| Prince Edward Island | 4 |
| Quebec | 135 |
| Saskatchewan | 32 |
| Yukon | 1 |
| Canada (all) | 618 |
10. Data QA/QC
The data validation strategy described in "A GIS-based method for identifying gaps in building footprint coverage" was employed for this new 2021 dataset.
The table below presents the comparison results for each province and territory.
| Province & territory | Sum from census data 2021 | Sum from Open Building Population Layer 2021 | Difference | Difference (%) |
|---|---|---|---|---|
| AB | 4,262,635 | 4,267,891 | 5,256.34 | 0.12 |
| BC | 5,000,879 | 5,000,388 | -490.73 | -0.01 |
| MB | 1,342,153 | 1,341,703 | -449.75 | -0.03 |
| NB | 775,610 | 775,776 | 165.5 | 0.02 |
| NL | 510,550 | 507,157 | -3,392.74 | -0.66 |
| NS | 969,383 | 968,790 | -593.06 | -0.06 |
| NU | 36,858 | 15,423 | -21,435.16 | -58.16 |
| NT | 41,070 | 39,334 | -1,736.39 | -4.23 |
| ON | 14,223,942 | 14,080,420 | -143,522.45 | -1.01 |
| PE | 154,331 | 154,414 | 82.82 | 0.05 |
| QC | 8,501,833 | 8,464,929 | -36,904.24 | -0.43 |
| SK | 1,132,505 | 1,132,039 | -465.56 | -0.04 |
| YK | 40,232 | 38,828 | -1,404.42 | -3.49 |
| Total | 36,991,981 | 36,787,091 | -204,890 | -0.56% |
There is a trend across most provinces and territories to have a re-calculated population lower than the official census population, which means that some population is not accounted for in the building population layer.
The jurisdictions with the largest differences are Nunavut (-58.16%), Yukon (-3.49%) and Northwest Territories (-4.23%), all located in Northern Canada. Specifically, this indicates that the open building population layer should not be used for analysis in Nunavut. The applicability of the layer in Yukon and Northwest Territories would also depend on the type of analysis conducted and level of detail required. Missing building footprints in the original building footprint data affects the quality of the Open Building Population Layer.
Differences for provinces located south of the 60th parallel range from -0.66% to +0.12%, indicating that the data layer captures a majority of the population in those regions. However, localized issues are present in each province and should be carefully reviewed before using the data layer.
The interactive map below was created to allow users to quickly identify gaps and limitations in the data layer. Review this data carefully if you plan on using the layer in your project or study. It includes calculated population differences for each census subdivision in Canada.
The comparison results at the census sub-division level are available for download here: Population difference per CSD for Canada (66 MB, uncompressed)
11. Limitations and potential improvements
If you find errors in the dataset or have ideas for potential contributions, please don’t hesitate to contact me using the contact form accessible from the site menu.
The following elements have been identified as limitations and potential improvements.
Population detail: The dataset provides an overview of the population density within a census dissemination area, averaged over the number of buildings located inside that dissemination area. The building population layer can be used for high-level assessments and approximation, but is not a reliable source of information to assess the number of people within a specific building unit or at a specific address.
Gaps in building layer: The Microsoft Bing dataset is one of the most complete, if not the most complete, building footprint layers publicly available for Canada. However, as documented in the Data QA/QC section, there are still limited populated areas where footprints are missing. When a gap in coverage is larger than a given dissemination area, the population from that census unit cannot be assigned to any buildings. This is the main reason why the building population estimates are slightly lower than the census population data (-0.56% across the county). Potential solutions include the combination of multiple building footprint data sources to fill the gaps.
Building height: The height data from the original Microsoft Bing footprint data was included in the open building population layer, but there are many inconsistencies in this data. Microsoft trained a neural network to estimate height above ground using imagery paired with height measurements, and then took the average height within a building polygon. There are many limitations associated with satellite-derived height estimates, and different approaches could be used to generate more accurate results. The building heights provided in the open building population layer should not be relied upon for detailed, site-specific or local analysis.
Land occupation: No differentiation is made with regards to the type of building (residential, commercial, industrial, institutional, etc.). As such, population is distributed evenly across all buildings in a census area, including non-residential buildings. Additional information related to zoning and land use could be integrated in the future to account for that aspect. The use of the dissemination area as the main census unit partly mitigates this limitation, since population density at this level of detail indirectly reflects land use (e.g. a dissemination area with mainly industrial or commercial buildings will present limited population).
Dissemination areas: It should be noted that there is a census unit smaller than dissemination areas called dissemination blocks (a dissemination area is composed of multiple dissemination blocks). However, there are many dissemination blocks for which population data is not published by Statistics Canada. It would be possible to do a “stitching” of the dissemination blocks that are publicly available, along with the dissemination areas estimates where the dissemination blocks are not available, in order to improve the overall resolution of the population data.
Year of census data: The layer was calculated using the 2021 census data. A new census should be conducted in 2026 by Statistics Canada, and detailed census data profiles will likely be available around 2028 (for year 2026).
12. License and attribution
The Open Building Population Layer (Canada) has been produced by Maxim Fortin as open and free data.
Dataset license
The dataset is released under the Open Database License (ODbL). This license allows you to freely use, distribute, and modify the dataset provided you attribute the source and share any modifications under the same license.
When using the dataset, please attribute as follows:
Fortin, Maxim (2024): Open Building Population Layer - Canada, derived from open-source computer-generated footprints and 2021 census data, URL: https://www.maximfortin.com/project/obpl-ca-2021/
No warranty is given as to the accuracy or completeness of the information provided. While the dataset provides estimates of population for each building in Canada, please note that these are derived approximations and do not represent exact population counts. Use caution when interpreting and utilizing the data for decision-making purposes.
Code license
The code is released under the Apache 2.0 License. This license allows you to freely use, distribute, and modify the code for both commercial and non-commercial purposes, with limited liability and warranty.
When using the code, please attribute as follows: Fortin, Maxim (2024): Python code for the Open Building Population Layer - Canada, derived from open-source computer-generated footprints and 2021 census data, URL: https://www.maximfortin.com/project/obpl-ca-2021/
No warranty is given as to the accuracy or completeness of the information provided. We provide no warranties and assume no responsibility for any liabilities associated with the use of this code.
Maxim Fortin
Water Resources Engineer
My professional interests include hydrological and hydraulic modeling, flood mapping and geospatial data analysis.