Open Building Population Layer (Canada) — v3
 Open Building Population Layer (Canada) v3
Table of Contents
1. Introduction
This dataset contains population estimates at the building level for all provinces and territories in Canada, calculated using publicly available census information. This data, along with accompanying code, can be downloaded and used freely under open-source licenses.
The v3 (2026) release includes approximately 14.9 million building footprints sourced from Public Safety Canada’s Canada Structures dataset, population allocation at the Dissemination Block level (498,547 units) using 2021 Census data, and an orphan population rescue mechanism that addresses population in dissemination blocks with zero buildings.
Both Points and Footprints layers are provided in the EPSG:3978 coordinate reference system.

2. Why this layer was developed
Population density products have long been used to quantify demographic information and to assess relationships with hazards, ecosystems, human health and infrastructure. However, there is currently a gap for a fine-resolution population density product covering all provinces and territories in Canada.
While proprietary datasets presenting this type of information already exist, they can be expensive. The public availability of remote sensing and free open-source data has significantly increased in recent years, making it now easier than ever to develop good population estimates all the way down to the building level, in the public domain.
The v2 (2023) release allocated population at the Dissemination Area level, which resulted in a −1.626% under-allocation gap because some dissemination areas had zero building footprints. Version 3 addresses this by:
- Using Dissemination Blocks (498,547 units) as the primary census unit, a tenfold increase in resolution over Dissemination Areas
- Adding an orphan rescue mechanism that redistributes population from dissemination blocks with census population > 0 but zero buildings to buildings in the same dissemination area
- Closing the population conservation gap from −1.626% (v2) to −0.015% (v3)
3. Potential use cases
Example 1: Floodplain population exposure
In this example, the data layer is used to assess the exposure of population to flood hazard as part of risk or priority setting assessments. Flood inundation extent layers are combined with the building population layer to approximate how many people may potentially be exposed to a particular flooding event.
The image below presents an example for a small community in Ontario, where the Open Building Population Layer was overlayed with a fictional riverine flood extent.

Through this analysis, the population potentially affected by flooding can easily be approximated by calculating a sum of the population for the buildings exposed to the flood hazard.
Example 2: Population coverage for new transit line
In this example, the data layer is used to estimate population living within a given radius of a new proposed transit line.

Buffers of 100 m, 500 m and 1,000 m were created around the proposed transit line. These buffers were then intersected with the Open Building Population Layer to estimate how many people may be covered at various distances for this fictional transit scenario.
4. Data sources for the layer
The Open Building Population Layer (Canada) v3 is calculated using two data sources:
Public Safety Canada — Canada Structures building footprints: Approximately 14.9 million building footprints from the Canada Structures dataset, freely available under the Open Government License (OGL). Each footprint includes a building height estimate where available. The product is provided in vector format created by Public Safety Canada (PS). This dataset has combines and harmonizes different building footprint sources into one, with a notable increase in coverage compared to the previously used Microsoft Bing Canada dataset (+2.5 million buildings.)
2021 Canada Census: Population distribution at the smallest available census geographical units, in a hierarchical fallback chain:
- Dissemination Blocks - DB (498,547 units)
- Dissemination Areas - DA (57,932 units)
- Census Subdivisions - CSD (5,161 units)
- Census Divisions - CD (293 units)
5. Methodology
The building population is estimated through the following pipeline:
- Load census data at the DB/DA/CSD/CD hierarchy and reproject to EPSG:3978
- Validate and repair census geometries
- Load Canada Structures building footprints and reproject to EPSG:3978
- Perform spatial joins of building representative points to each census level
- Calculate population-per-building ratios:
- DB_RATIO = DB_POP / COUNT_DB
- DA_RATIO = DA_POP / COUNT_DA (fallback)
- CSD_RATIO = CSD_POP / COUNT_CSD (fallback)
- CD_RATIO = CD_POP / COUNT_CD (fallback)
- Orphan rescue: redistribute population from DBs with census population > 0 but zero buildings to buildings in the same DA
- Assign: BLDG_POP = best_available_ratio + ORPHAN_RATIO, rounded to 3 decimal places
- Output: Points and Footprints geopackages per province and nationally
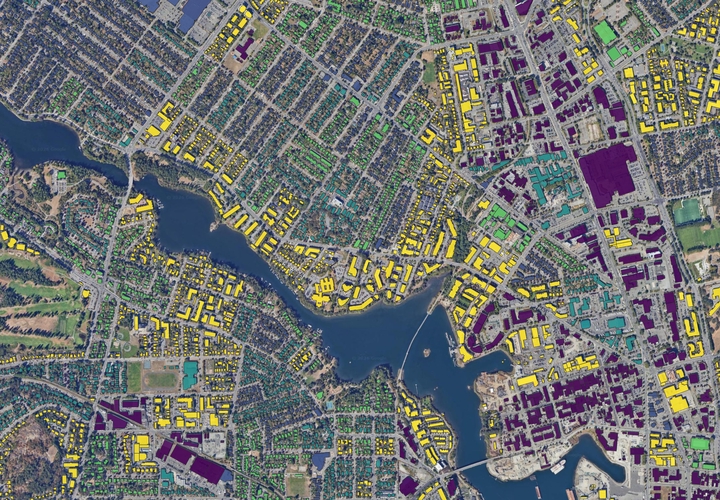
The image below shows a close-up view of dissemination areas in urban settings, along with an indication of the building population at each point.

The calculation process is automated in Python. The main packages used for the geospatial analysis are GeoPandas and Pyogrio.
The code is available here in a Codeberg repository.
6. Data dictionary
Data fields provided with this data layer are described below:
| Field | Type | Description |
|---|---|---|
| BLDG_ID | int | Building index within province (non-unique nationally) |
| BLDG_UID | str | Nationally unique building identifier (PROV_ID format) |
| HEIGHT | float | Building height in metres (3 decimal places) |
| DBUID | str | Dissemination Block unique identifier |
| DB_RATIO | float | Population per building at DB level (3 decimal places) |
| DAUID | str | Dissemination Area unique identifier |
| DA_RATIO | float | Population per building at DA level (3 decimal places) |
| CSDUID | str | Census Subdivision unique identifier |
| CSD_RATIO | float | Population per building at CSD level (3 decimal places) |
| CDUID | str | Census Division unique identifier |
| CD_RATIO | float | Population per building at CD level (3 decimal places) |
| ORPHAN_RATIO | float | Bonus population from orphaned DBs (3 decimal places) |
| HAS_ORPHAN_BONUS | int | 1 if building receives orphan bonus, 0 otherwise |
| BLDG_POP | float | Estimated building population (3 decimal places). Sourced from DB_RATIO, DA_RATIO, CSD_RATIO, CD_RATIO, or NONE. |
| POP_SOURCE | str | Ratio used: DB_RATIO, DA_RATIO, CSD_RATIO, CD_RATIO, or NONE |
7. Data sample (interactive web map)
The interactive map below shows a sample area in Ottawa, Ontario. Use the layer toggle in the top-right corner to switch between building points and building footprints, and to change the basemap.
8. Improvements since v2 (2023)
| Aspect | v2 (2023) | v3 (2026) |
|---|---|---|
| Primary census unit | Dissemination Area (57,932) | Dissemination Block (498,547) |
| Fallback chain | DA → CSD → CD → PT | DB → DA → CSD → CD |
| Building footprints | Microsoft Bing (12.3M) | Public Safety Canada Structures (~14.9M) |
| Orphan rescue | None | Population from 0-building DBs redistributed |
| Population conservation gap | −1.626% | −0.015% |
| Output precision | Full float | 3 decimal places |
9. Building population files
The following files are available for download in zipped geopackage format (EPSG:3978 coordinate reference system).
File packages are provided for each province and territory, along with a complete country-wide package.
Building footprints
| Province/Territory | Zipped MB |
|---|---|
| Alberta | 252 |
| British Columbia | 212 |
| Manitoba | 91 |
| New Brunswick | 51 |
| Newfoundland and Labrador | 34 |
| Northwest Territories | 4 |
| Nova Scotia | 61 |
| Nunavut | 2 |
| Ontario | 657 |
| Prince Edward Island | 10 |
| Quebec | 364 |
| Saskatchewan | 95 |
| Yukon | 2 |
| Canada (all) | 1828 |
Building points
| Province/Territory | Zipped MB |
|---|---|
| Alberta | 107 |
| British Columbia | 84 |
| Manitoba | 42 |
| New Brunswick | 24 |
| Newfoundland and Labrador | 17 |
| Northwest Territories | 1 |
| Nova Scotia | 27 |
| Nunavut | 1 |
| Ontario | 250 |
| Prince Edward Island | 5 |
| Quebec | 168 |
| Saskatchewan | 44 |
| Yukon | 1 |
| Canada (all) | 758 |
10. Data QA/QC
The building population layer was validated by comparing the sum of BLDG_POP for each province and territory against the official 2021 Census dissemination block population totals. Additional QA/QC was also done to validate features, geometries and results by comparison between v2 and v3.
| Province & territory | Census DB population 2021 | Sum of BLDG_POP | Difference | Difference (%) |
|---|---|---|---|---|
| NL | 510,545 | 511,272.7 | +727.7 | +0.143 |
| PE | 154,331 | 154,466.2 | +135.2 | +0.088 |
| NS | 969,383 | 970,161.1 | +778.1 | +0.080 |
| NB | 775,610 | 776,061.0 | +451.0 | +0.058 |
| QC | 8,501,833 | 8,514,167.0 | +12,334.0 | +0.145 |
| ON | 14,223,942 | 14,222,563.0 | −1,379.0 | −0.010 |
| MB | 1,342,153 | 1,346,313.6 | +4,160.6 | +0.310 |
| SK | 1,132,505 | 1,132,249.1 | −255.9 | −0.023 |
| AB | 4,262,635 | 4,269,294.6 | +6,659.6 | +0.156 |
| BC | 5,000,874 | 5,002,649.5 | +1,775.5 | +0.036 |
| YT | 40,232 | 40,191.0 | −41.0 | −0.102 |
| NT | 41,070 | 41,075.9 | +5.9 | +0.014 |
| NU | 36,858 | 36,876.4 | +18.4 | +0.050 |
| Total | 36,991,971 | 37,017,341.1 | +25,370.1 | +0.069 |
The overall population conservation gap is −0.015% at the national level (computed as the sum of all provincial differences divided by the total census population, accounting for the orphan bonus redistribution). Some provinces show slight over-allocation (NL, PE, NS, NB, QC, MB, AB, BC, NT, NU), which is due to the orphan bonus redistribution: population from dissemination blocks with census population > 0 but zero buildings is reassigned to buildings in the same dissemination area. Other provinces show slight under-allocation (ON, SK, YT) for the same mechanical reasons.
Key metrics:
- Approximately 99.6% of buildings receive population via DB_RATIO (dissemination block level)
- 1,808,449 buildings receive an orphan bonus
- Only 3 buildings nationally have no population source (POP_SOURCE = NONE)
- 843 dissemination blocks have suppressed (null) population data
11. Limitations and potential improvements
If you find errors in the dataset or have ideas for potential contributions, please don’t hesitate to contact me using the contact form accessible from the site menu.
The following elements have been identified as limitations and potential improvements.
Population detail: The dataset provides an overview of the population density within a census dissemination block, averaged over the number of buildings located inside that dissemination block. The building population layer can be used for high-level assessments and approximation, but is not a reliable source of information to assess the number of people within a specific building unit or at a specific address.
Census data year: The layer was calculated using the 2021 Census data. A new census should be conducted in 2026 by Statistics Canada, and detailed census data profiles will likely be available around 2028 (for year 2026).
Suppressed dissemination blocks: There are 843 dissemination blocks for which population data is not published by Statistics Canada (privacy-suppressed). These blocks receive population through fallback ratios at the DA, CSD, or CD level. The source of the population ratio used for a specific building can be confirmed in the feature data with the “POP_SOURCE” field.
Orphan bonus over-allocation: In some provinces (NL, MB, QC, AB), the orphan bonus redistribution can result in slight over-allocation because population from 0-building DBs is distributed to buildings in the same DA, which may already have been assigned population from their own DB.
Building footprint gaps: The Canada Structures dataset may have gaps in coverage in remote and northern areas. The applicability of the layer in Yukon, Northwest Territories, and particularly Nunavut should be carefully reviewed before use. Building footprint age also varies, since Canada Structures is a compilation of other national footprint compilations. There may be gaps for recent constructions or changes in land use.
Building height: Height data quality varies by source and should not be relied upon for detailed, site-specific, or local analysis.
Land occupation: No differentiation is made with regards to the type of building (residential, commercial, industrial, institutional, etc.). Population is distributed evenly across all buildings in a census area, including non-residential buildings.
12. License and attribution
The Open Building Population Layer (Canada) v3 has been produced by Maxim Fortin as open and free data.
Dataset license
The dataset is released under the CC BY 4.0. This license allows you to freely use, distribute, and modify the dataset provided you attribute the source and share any modifications under the same license.
When using the dataset, please attribute as follows: Fortin, Maxim (2026). Open Building Population Layer — Canada v3. https://www.maximfortin.com/project/obpl-ca-2021/
No warranty is given as to the accuracy or completeness of the information provided. While the dataset provides estimates of population for each building in Canada, please note that these are derived approximations and do not represent exact population counts. Use caution when interpreting and utilizing the data for decision-making purposes.
Upstream data sources: This project includes or derives from data licensed under the Open Government License – Canada. All required attributions are preserved in the dataset metadata.
Code license
The code is released under the Apache 2.0 License. This license allows you to freely use, distribute, and modify the code for both commercial and non-commercial purposes, with limited liability and warranty.
When using the code, please attribute as follows: Fortin, Maxim (2026). Python code for the Open Building Population Layer — Canada v3. https://www.maximfortin.com/project/obpl-ca-2021/
No warranty is given as to the accuracy or completeness of the information provided. We provide no warranties and assume no responsibility for any liabilities associated with the use of this code.
Maxim Fortin
Water Resources Engineer
My professional interests include hydrological and hydraulic modeling, flood mapping and geospatial data analysis.